Still no EV Kerbside Chargers for Postcode 2107 Despite 66 allocated for across the peninsula in latest grant funding announced: Mapping Photovoltaic installations Across Pittwater Postcodes: some More data
On July 9 2025 the NSW Government announced Electric Vehicle drivers in NSW will soon have access to another 549 new kerbside chargers across 130 suburbs, thanks to a $2.8 million investment by the government. The announcement states 66 are being allocated to the NBC LGA, however, with a focus this round on drivers who don't have off-street parking, such as those who live in apartments and dense housing areas, postcode 2107 - the Avalon Beach, Clareville and Bilgola area, is again missing from the list of those which will see an installation of these. .
The investment will see the installation of chargers ranging from 7 kilowatts to 22 kilowatts and will include pole mounted and pedestal EV chargers. They will be installed on kerbsides and in public council car parks over the next 12 months.
The loss of income from charging for a single space in public council carparks had been cited as a reason to delay placing one of these in Avalon Beach carpark earlier in 2025.
A 7kW EV charger will typically take around 8 hours to fully charge a 60kWh electric vehicle from empty. The charging time can vary based on the vehicle's battery capacity, the initial charge level, and the charger's efficiency. A standard electric car (70kWh battery) requires 10 hours to fully charge from empty-to-full using a 7kW charging point.
A 22kW EV charger can typically fully charge an electric vehicle in 3-4 hours, but this can vary depending on the vehicle's battery capacity and its ability to accept that charging rate. Some EVs might not be able to utilize the full 22kW capacity due to their onboard charging limitations.
No details as to what the mix of 7 kilowatts to 22 kilowatts is, or where the other 48 will be located has been provided - but 18 have been allocated for Pittwater; 6 in Narrabeen, 8 in Mona Vale and 4 in Newport.
The government states the new chargers will make EV charging easier, more accessible and convenient for drivers who don't have off-street parking, such as those who live in apartments and dense housing areas.
''Electric vehicles help slash household transport costs and accelerate our efforts to reach the state’s legislated net zero emissions targets. Expanding the EV charging network is key, giving drivers the confidence to go electric with ample options to top up their vehicles.
The $2.8 million in EV Kerbside Charging Grants have been awarded to five recipients, who will contribute another $2.2 million in private investment to install the chargers. The recipients are Charge Post, Connected Kerb, EVX, Plus ES and EF Asset Management.'' the release states
Sydney based electric vehicle (EV) charging infrastructure company EVX states it expects to deliver over half of the new kerbside chargers that the New South Wales government announced. EVX says it will deliver 278 new kerbside chargers, specifically its Australian-designed and made pole-mounted EV chargers. EVX pole-mounted chargers will be installed across 13 local council areas including Bayside, Parramatta, Ryde, Newcastle, Northern Beaches, and the City of Sydney.
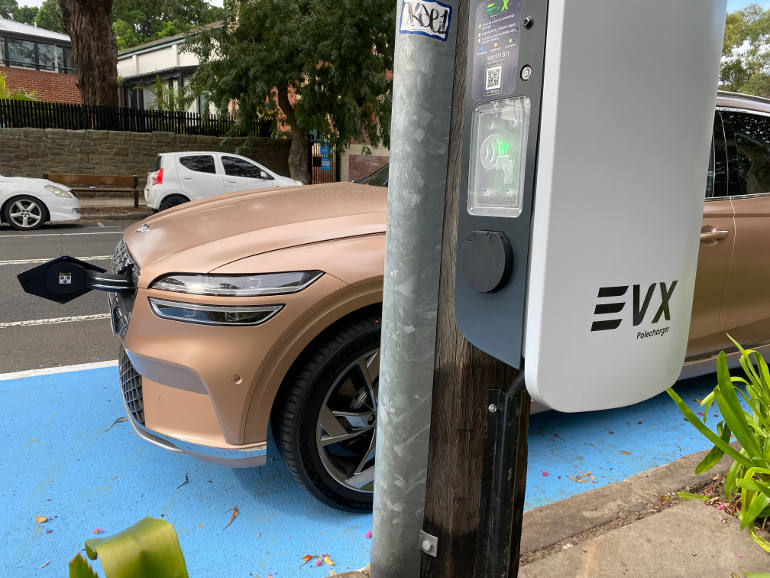
A 22kw EVX pole-mounted charger is already installed at 22 Bishop street Newport, 30 The Esplanade, Narrabeen, 3-5 Hilltop Cres, Curl Curl, Passmore Reserve, Campbell Parade, Manly Vale, 3-5 Hilltop Cres, Fairlight, and at Clontarf Reserve, Sandy Bay Road.
EVX pole-mounted charger
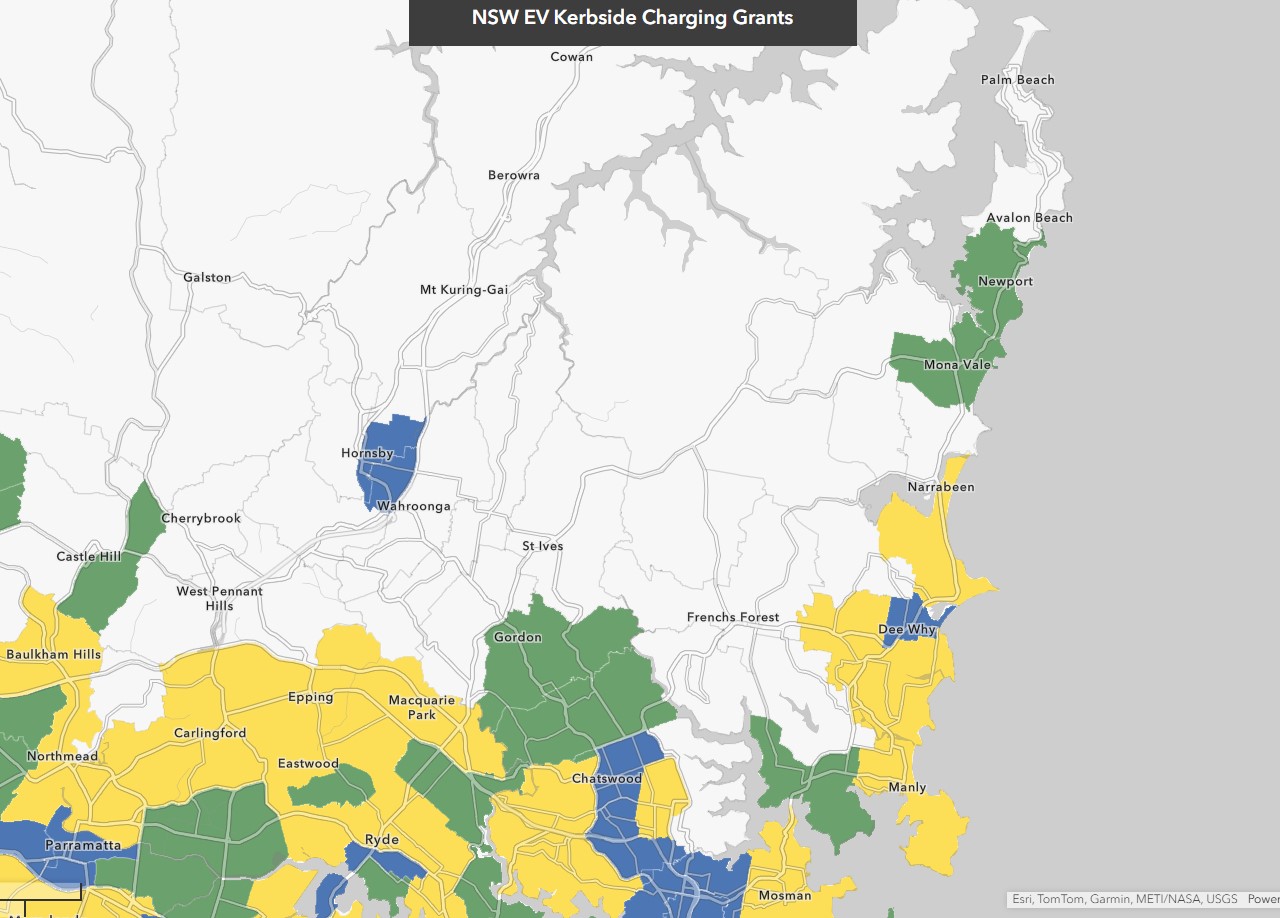
Interestingly, those areas with a high uptake of PV Systems have been allocated further EV Charger installations.
Data extracted from the Australian PV Institute (APVI) Solar Map researched (see below) would indicate those in that still neglected postcode must be charging their vehicles via their own paid-for-by-themselves equipment.
The NSW Government's EV Charging Map (see below) shows just two suburbs that qualify in Pittwater for 'needed' grants - Mona Vale and Newport. This will be news to those living in other suburbs of Pittwater, many of whom are pensioners and families with young children who moved to this area because it was one of the few places they could afford to buy.
Similar 'they can afford it' presumptions in recent years have seen the closure and demolition of Mona Vale Public Hospital and the foisting on the Pittwater population of the inaccessible-when-it's-raining private Northern Beaches Hospital - the paper-soldier standard in community healthcare.
The continued omission would not encourage or 'give drivers confidence' or further the uptake of EV's in 2107 and 2108, or finally institute a place where visitors in EVs will be able to access the same in that 2107- Avalon-Clareville-Bilgola area, despite data records itemising the growth in EV purchases in postcode 2107.
See April 2025 report:
Scamps' Call for Residential Battery Subsidies May Ease Council's EV-Charging Stations Dilemma + Solar for Apartment Residents incentive open until December 31 + EV and Hybrid vehicle data for our area by postcode + NSW Inquiry into Infrastructure for electric and alternative energy source vehicles in NSW (closing date for submissions is Friday 2 May 2025) + ‘A house battery you can drive around’: how a handful of Australians are selling power from their cars back to the grid
The chargers will be installed across 22 Local Government Areas:
City Of Parramatta – 70
Inner West – 47
City of Sydney – 48
Bayside – 37
Northern Beaches – 66
Newcastle City – 48
Ryde City – 42
Ku-ring-gai – 25
Penrith City – 14
Hunter's Hill – 26
Strathfield – 24
Hornsby Shire – 22
The Hills Shire – 10
Cumberland – 9
Willoughby City – 18
Woollahra – 9
Wollongong City – 12
Randwick City – 7
Waverley– 7
Lane Cove – 2
Shellharbour – 4
Sutherland Shire – 2
While this grant focuses on densely populated areas, the NSW Government is also boosting the EV charging network in regional areas through the EV Destination and EV Fast Charging Grants.
Acting Minister for Climate Change and Energy, The Hon. Paul Scully, said:
“Expanding our charging network gives drivers the confidence they need to go electric, knowing ample charging options are readily available, even if they don’t have a garage or off-street parking.
“EVs give people the chance to slash household transport costs and accelerate our journey to net-zero emissions – every EV charger installed brings us closer to a cleaner, more affordable transport future.”
18 New EV Chargers for Pittwater
There will be 18 new chargers in Pittwater, installed in the following locations:
- 2 chargers - 72-90 Ocean St, Narrabeen
- 4 chargers - 2-4 Malcolm St, Narrabeen
- 4 chargers - 1 Surfview Rd, Mona Vale
- 4 chargers - 1610 Pittwater Road, Mona Vale
- 2 chargers - 13 Kalinya St, Newport
- 2 chargers - 405 Barrenjoey Rd, Newport
Independent Pittwater MP Jacqui Scruby said the investment would help meet growing demand and ensure residents who don’t have access to off-street parking aren’t left behind in the EV transition.
“This is a win. These fast chargers make owning an EV more practical and convenient for more people – especially renters, apartment dwellers, and anyone without a driveway or a battery,” said Ms Scruby.
“We're cutting pollution, reducing household transport costs, and giving people more reasons to make the switch to electric. With these chargers, we’re powering up local infrastructure for a cleaner future.”
Member for Manly, James Griffin MP, has also welcomed the announcement.
"One of the biggest barriers to EV uptake has been access to charging for those who live in apartments or older housing stock. These new chargers are a game-changer for locals who want to make the switch to electric but haven’t had a practical way to do so,” said Mr Griffin.
“EVs aren’t just beneficial for the environment – they’re also cheaper to run. As people face rising costs of living, this kind of infrastructure helps ease household transport costs and fast-track our path to net zero emissions.”
Mr Griffin said the investment highlights the importance of policy continuity in delivering long-term benefits for the community and the environment.
"The Coalition laid the groundwork for this transition – I’m proud of that legacy and pleased to see it being built upon in a way that benefits people right here in Manly.''
The list of where the other 48 EV chargers will be installed has not been released as yet.
Kerbside Charging Map
Priority zone tier Description Co-funding cap
Green Areas where the most NSW Government co-funding support is needed $10,000 (ex GST) per charge port
Yellow Areas where moderate NSW Government co-funding support is needed $8,000 (ex GST) per charge port
Blue Areas where less NSW Government co-funding support is needed $6,000 (ex GST) per charge port
All chargers must be installed in these zones. The list of eligible zones may be reviewed and modified for subsequent funding rounds to ensure program objectives continue to be met.
The chargers will be installed over the next 12 months and include both pole-mounted and pedestal models.
PV systems data
These maps are based on data from the Clean Energy Regulator, the Australian Government agency tasked with the administration of the Renewable Energy Target. Data from the Clean Energy Regulator is up to date as of 31 March 2025, however the number of systems installed may be understated due to the lag in system registrations. The maps are
funded by the Australian Renewable Energy Agency, and accessed from pv-map.apvi.org.au.
Photovoltaic (PV) refers to the process of converting light into electricity using semiconducting materials. This conversion, known as the photovoltaic effect, is the principle behind solar cells, which are the core components of solar panels. These panels, when exposed to sunlight, generate direct current (DC) electricity, which can then be used to power homes, businesses, or fed into the electrical grid.
For each postcode, local government area, and state electorate, the map shows the estimated percentage of houses that have a PV system and the total photovoltaic capacity installed.
Most of the PV systems in Australia are small-scale residential, and increasingly, commercial rooftop installations, which can be explored further via the PV Postcode Tool. There are also a growing number of larger-scale PV power stations with a capacity of 100kW or more. These power stations are indicated by individual markers on this map, and are detailed on the Large-Scale PV Systems page. Live performance data is available for systems in the Desert Knowledge Precinct in Alice Springs, and at the University of Queensland.
This map was created by correlating data from a number of sources:
- Data from the Clean Energy Regulator, including the Small-scale Generation Unit (SGU) database of solar PV systems with a rated capacity of less than 100 kW. The dataset includes accredited solar photovoltaic (PV) systems installed since April 2001. As such, it includes most, but not all, of the rooftop solar PV systems in Australia. However, it does not account for systems that have been decommissioned.
- Solar PV generators that are registered under the Large-scale Renewable Energy Target (LRET) and are greater than 100 kW rated capacity. Decommissioned systems have been removed from this dataset.
- Postal Area (POA), Local Government Area (LGA) and State Electoral Division (SED) boundary data from the Australian Bureau of Statistics, SA Government (2018 SED boundaries) and PSMA
- Data from the Australian Bureau of Statistics for the number of suitable (freestanding and semi-detached) houses in each postcode is used. The data is based on the Census 2021, adjusted quarterly by assuming that the house growth rate since the 2021 Census is equal to that seen in the area between the most recent 2016 and 2021 censuses
- The PV potential on all roof types was calculated for this report, based on estimated building footprints derived from the PSMA Geoscape database. A more detailed description of the method can be accessed here.
Since Clean Energy Regulator data does not distinguish between PV systems installed on residential and commercial buildings, for the purposes of this map, we must assume a size threshold for residential systems.
- Before 2018, all PV systems installed below or equal to 10kW were classified as residential, and those greater than 10kW were classified as 'commercial' PV systems. Power stations were any system above 100kW.
- To account for an increase in the size of residential systems, the threshold for residential/commercial systems was incrementally raised to 15kW. In 2018, systems below or equal to 11kW were classified as residential. In 2019, systems below or equal to 12kW were classified as residential, and so on, until 2022, when systems below or equal to 15kW were classified as residential.
- After 2022, all systems below or equal to 15kW are residential, and those greater than 15kW are classified as commercial PV systems. Power stations are any system above 100kW.
The percentage of houses with a PV system shown on the map is estimated by comparing the total number of freestanding and semi-detached houses with the number of residential PV systems installed in each area.
* Where the percentage of houses with a PV system is over 90%, likely due to significant changes to postcode boundaries over time, we do not report the percentage of houses with a PV system. When negative rate of change in houses causes a negative number of houses or over 70% of houses with a PV system in the area, we disregard the rate of change and use the number of houses from the 2021 census without adjusting for decline.
PV installation data, aggregated monthly for each postcode, is made available for public download by the Clean Energy Regulator.
Pittwater Postcodes: PV data
2108 (Coasters Retreat, Great Mackerel Beach, Palm Beach)
Est. houses: 1195
Installations: 211 (approx. 16.8% of dwellings)
PV potential on all roof types: 120498m2 (18828 kW)
Potential annual energy from rooftop PV: 24.3 GWh
Total installed capacity: 1598 kW
Residential: 1395 kW (installations: 201)
Commercial: 203 kW (installations: 10)
Power Stations: 0 kW (installations: 0)
2107 (Avalon Beach, Bilgola Beach, Bilgola Plateau, Clareville, Whale Beach)
Est. houses: 5539
Installations: 1370 (approx. 23.5% of dwellings)
PV potential on all roof types: 426883m2 (66700 kW)
Potential annual energy from rooftop PV: 86.2 GWh
Total installed capacity: 9886 kW
Residential: 8500 kW (installations: 1303)
Commercial: 1386 kW (installations: 67)
Power Stations: 0 kW (installations: 0)
2106 (Newport)
Est. houses: 2941
Installations: 704 (approx. 22.6% of dwellings)
PV potential on all roof types: 241929m2 (37801 kW)
Potential annual energy from rooftop PV: 48.8 GWh
Total installed capacity: 5121 kW
Residential: 4317 kW (installations: 666)
Commercial: 804 kW (installations: 38)
Power Stations: 0 kW (installations: 0)
2105 (Church Point, Elvina Bay, Lovett Bay, Morning Bay, Scotland Island)
Est. houses: 893
Installations: 179 (approx. 18.7% of dwellings)
PV potential on all roof types: 50817m2 (7940 kW)
Potential annual energy from rooftop PV: 10.3 GWh
Total installed capacity: 1326 kW
Residential: 1035 kW (installations: 167)
Commercial: 291 kW (installations: 12)
Power Stations: 0 kW (installations: 0)
2104 (Bayview)
Est. houses: 1309
Installations: 377 (approx. 25.9% of dwellings)
PV potential on all roof types: 123544m2 (19304 kW)
Potential annual energy from rooftop PV: 24.9 GWh
Total installed capacity: 3072 kW
Residential: 2267 kW (installations: 339)
Commercial: 805 kW (installations: 38)
Power Stations: 0 kW (installations: 0)
2103 (Mona Vale)
Est. houses: 3073
Installations: 1020 (approx. 31.2% of dwellings)
PV potential on all roof types: 359147m2 (56117 kW)
Potential annual energy from rooftop PV: 72.7 GWh
Total installed capacity: 8314 kW
Residential: 6268 kW (installations: 960)
Commercial: 2046 kW (installations: 60)
Power Stations: 0 kW (installations: 0)
2102 (Warriewood)
Est. houses: 2444
Installations: 856 (approx. 33.4% of dwellings)
PV potential on all roof types: 255431m2 (39911 kW)
Potential annual energy from rooftop PV: 51.7 GWh
Total installed capacity: 6291 kW
Residential: 4707 kW (installations: 816)
Commercial: 1476 kW (installations: 39)
Power Stations: 108 kW (installations: 1)
2101 (Elanora Heights, Ingleside, Narrabeen, North Narrabeen)
Est. houses: 5225
Installations: 1453 (approx. 25.9% of dwellings)
PV potential on all roof types: 537436m2 (83974 kW)
Potential annual energy from rooftop PV: 108.2 GWh
Total installed capacity: 10258 kW
Residential: 8058 kW (installations: 1354)
Commercial: 2200 kW (installations: 99)
Power Stations: 0 kW (installations: 0)
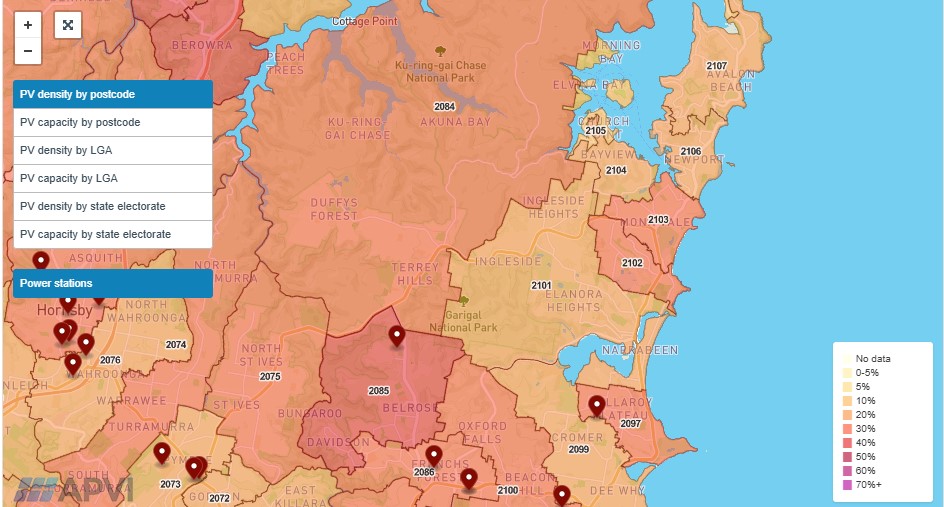
PV Density by postcode: Australian PV Institute (APVI) Solar Map
Compare Belrose - highest uptake on peninsula at 47.6%:
2085 (Belrose, Davidson)
Est. houses: 3245
Installations: 1602 (approx. 47.6% of dwellings)
PV potential on all roof types: 390867m2 (61073 kW)
Potential annual energy from rooftop PV: 78.7 GWh
Total installed capacity: 11718 kW
Residential: 9722 kW (installations: 1545)
Commercial: 1815 kW (installations: 56)
Power Stations: 181 kW (installations: 1)
2084 (Cottage Point, Duffys Forest, Ku-Ring-Gai Chase, Terrey Hills)
Est. houses: 1250
Installations: 515 (approx. 35.1% of dwellings)
PV potential on all roof types: 239397m2 (37406 kW)
Potential annual energy from rooftop PV: 48.4 GWh
Total installed capacity: 4915 kW
Residential: 2879 kW (installations: 439)
Commercial: 2036 kW (installations: 76)
Power Stations: 0 kW (installations: 0)
2097 (Collaroy, Collaroy Plateau, Wheeler Heights)
Est. houses: 4007
Installations: 1409 (approx. 34.2% of dwellings)
PV potential on all roof types: 325208m2 (50814 kW)
Potential annual energy from rooftop PV: 65.5 GWh
Total installed capacity: 9182 kW
Residential: 8400 kW (installations: 1372)
Commercial: 782 kW (installations: 37)
Power Stations: 0 kW (installations: 0)
2100 (Allambie Heights, Beacon Hill, Brookvale, Frenchs Forest, North Manly, Oxford Falls)
Est. houses: 6256
Installations: 2297 (approx. 34.1% of dwellings)
PV potential on all roof types: 834111m2 (130330 kW)
Potential annual energy from rooftop PV: 169.5 GWh
Total installed capacity: 18933 kW
Residential: 13407 kW (installations: 2136)
Commercial: 4933 kW (installations: 158)
Power Stations: 593 kW (installations: 3)
2095 (Manly)
Est. houses: 1900
Installations: 564 (approx. 27.7% of dwellings)
PV potential on all roof types: 268868m2 (42011 kW)
Potential annual energy from rooftop PV: 54.2 GWh
Total installed capacity: 4037 kW
Residential: 3117 kW (installations: 527)
Commercial: 920 kW (installations: 37)
Power Stations: 0 kW (installations: 0)
About the Australian PV Institute (APVI) Solar Map
The Australian PV Institute is a not-for-profit, member-based organisation providing data analysis, reliable and objective information, and collaborative research to support the development and uptake of solar photovoltaics and related technologies.
APVI members are organisations and individuals from industry and academia with an interest in solar energy research, technology, manufacturing, systems, policies, programs and projects.
The APVI organises the Asia-Pacific Solar Research Conference (APSRC), a regional forum for communicating outcomes covering all aspects of solar-related research.
In conjunction with academia, governments and industry, APVI develops high quality solar analysis tools. In addition to Australian activities, we provide the structure through which Australia participates in two International Energy Agency (IEA) programs.
Our work is intended to be apolitical and of use not only to our members but also to the general community. We focus on data analysis, independent and balanced information, and collaborative research, both nationally and internationally. As well as solar PV and solar heating and cooling, APVI is interested in a range of related technologies (including batteries and other storage, electric vehicles, heat pumps, demand management, monitoring and control, etc.), with specific reference to how they enable and support the deployment and integration of solar technologies.
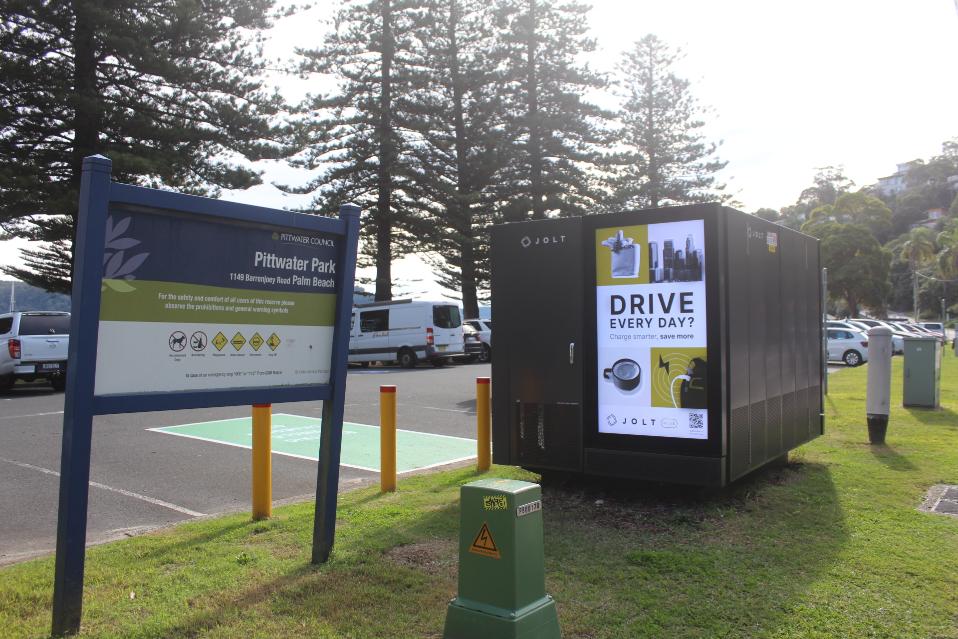
The JOLT EV charger battery installed at Pittwater Park, Palm Beach was a lot larger than that originally slated for Governor Phillip Park, Palm Beach.


%20(1).jpg?timestamp=1675893929686)

.JPG.opt1460x973o0,0s1460x973.jpg?timestamp=1663629195339)


