September 1 - 30, 2026: Issue 658


Crested Tern at Warriewood is Pittwater's First H5 Bird Flu Fatality

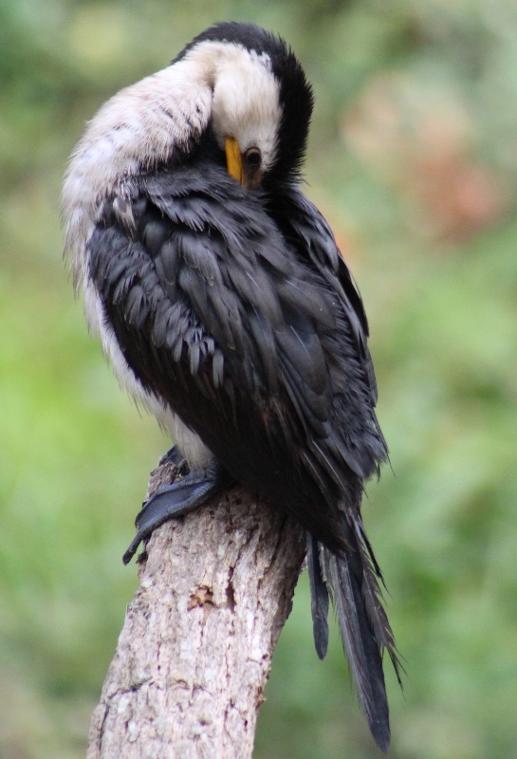
Fledgling Crested Tern at south Mona Vale Beach, picture by A J Guesdon, 2014
A Crested Tern reported to authorities by a Warriewood resident on August 28 has become Pittwater's first H5 Bird Flu fatality. 

The NSW Government officially announced the death on Thursday September 3, stating two other cases, another Crested Tern at Port Kembla, and a Hutton’s shearwater at Corindi in Coffs Harbour, were confirmed cases.

This is the first confirmed detection in a shearwater bird in NSW.

As of 3 September 2026, there are 20 H5 bird events in NSW and 468 across Australia.

FULL REPORT HERE


Hazard reduction burn in Ku-ring-gai Chase National Park

Notification: September 3 2026

The National Parks and Wildlife Service (NPWS), with assistance from the NSW Rural Fire Service, will be conducting a hazard reduction burn in Ku-ring-gai Chase National Park starting Thursday 3 September, and concluding Sunday 6 September, subject to suitable weather conditions.

The 230-hectares burn at Bobbin Head East will be bound by the Sphinx Trail to the south, the Bobbin Head Trail to the west, and Cowan Creek to the north and east. The aim of the burn is to reduce the chance of bushfire impacts to the park, neighbours and nearby communities.

All tracks and trails within the burn area will be closed for the duration of the burn, including Bobbin Head Trail, Jacombs Trail, Sphinx Trail and Track, Memorial Rd, Warrimoo Track, Bibbenluke Trail, Booralie Trail, Duffys Wharf Trail, Slades Trail, Darri Track, Murrua Trail and Gibberagong Track. Tracks will be reopened once they have been assessed as safe.

Motorists are reminded to drive to conditions and are advised to take care if visibility is reduced by smoke.

The NPWS Bobbin Head visitor precinct will remain open, including Bobbin Head Visitor Centre and Bobbin Inn Cafe, Empire Marina, and the surrounding visitor facilities.

Smoke may affect the area and people with asthma or other respiratory problems are advised to keep clear of the area or stay indoors, close windows and doors, and follow their health plan.

This burn is one of many hazard reduction operations undertaken by NPWS across NSW each year, many with assistance from the Rural Fire Service and Fire and Rescue NSW.

These hazard reduction burns are essential to reduce bushfire fuel loads to help protect the parks, their natural and cultural values, neighbours and communities from summer bushfires.

People with known health conditions can sign up to receive air quality reports, forecasts and alerts via email or SMS from the Department of Climate Change, Energy, the Environment and Water.

For health information relating to smoke from bushfires and hazard reduction burns, visit NSW Health or Asthma Australia.

More information on hazard reduction activities is available at NSW Rural Fire Service and the NSW Government's Hazards Near Me website and app

New fishing rule to protect critically endangered Greynurse sharks at Terrigal Haven

Announced: Thursday September 3, 2026

The Minns Labor Government has introduced a new fishing rule at Terrigal Haven on the Central Coast to help protect critically endangered Greynurse sharks following community concern of the behaviour of some fishers targeting these sharks.

Greynurse sharks are listed as critically endangered in NSW and remain vulnerable to fishing-related impacts. The local Terrigal community are highly protective of these Greynurse juveniles who are part of the marine environment which makes Terrigal a special coastal place.

The Government’s targeted measure follows reports of Greynurse sharks being caught by fishers using wire traces to specifically target the young sharks in the area.

From Friday 4 September, the use of wire trace, chain trace and fishing lines consisting of wire or chain will be prohibited within a specific closure area for a period of five years.

Any Greynurse Shark captured incidentally should be released immediately to the waters from where the fish came with the least possible harm.

Wire traces are commonly used to target large sharks, and the closure is intended to reduce the risk of capture, injury and death of Greynurse sharks.

The closure area is waters extending from the shoreline at the Terrigal Rock Pool (adjacent to the Terrigal Boardwalk), encompassing all waters of Terrigal Haven to Terrigal Point (north-north-east of the Terrigal Boat Ramp). The rules will apply to all fishers and include waters adjacent to the Terrigal boardwalk, encompassing Terrigal Haven and surrounding waters.

The new rules do not prohibit recreational fishing at Terrigal Haven, with fishers able to continue to enjoy fishing in the area while helping safeguard this threatened species.

Over the coming months, Department of Primary Industries and Regional Development (DPIRD) recreational fishing education officers will be at Terrigal Haven to promote awareness of the new closure and fishing rules, particularly in relation to Greynurse sharks.
The new fishing rules will be supported through on-site signage, public awareness initiatives, and compliance activities.

The five-year period will allow the NSW Government to assess the effectiveness of the measures in reducing the impact of interactions with Greynurse sharks across a range of fishing seasons and environmental conditions.

On-the-spot fines of $500 to $1,500 apply for fishing in the closure area using a fishing line fitted with a wire or chain trace, or a line consisting of wire or chain. Maximum court-imposed penalties of $22,000 and/or six months imprisonment apply for an individual's first offence.

Anyone who sees fishers doing the wrong thing is encouraged to contact DPIRD via Fishers Watch on 1800 043 536 or submit a report online.

For more information, including maps of the closure area, visit: www.dpi.nsw.gov.au/fishing/species-protection/what-current/critically/grey-nurse-shark 

Minister for Agriculture Tara Moriarty said:

"These targeted measures will help reduce the risk of harm to the Terrigal community’s special young Greynurse sharks, while ensuring recreational fishers are not impacted at Terrigal Haven.

"Reports of Greynurse sharks being hooked with wire trace attached are concerning and demonstrate why additional protections are needed.

"These practical changes strike the right balance between protecting a critically endangered species and ensuring fishers can continue to enjoy this popular fishing location."

Minister for the Central Coast David Harris said:

"Terrigal Haven has become a regular habitat for Greynurse sharks in recent years, and local residents have raised concerns about interactions between fishers and these animals.

"The Central Coast is home to important marine environments, and we have a responsibility to protect threatened species that call these waters home.

"These new rules are a sensible and targeted response that supports conservation while maintaining recreational fishing access to this iconic location."

The Shark Meshing (Bather Protection) Program 2025/26 Annual Performance Report recorded 10 Greynurse Sharks (3 dead, 7 released alive) were caught in the nets - most of these in the Central Coast nets.

Community invited to imagine a symbiotic future

The council is inviting the community to join 3 leading creative and environmental thinkers for a timely conversation about how people, nature and the places we live can work better together.

CEAD Panel 2026: Imagining our Symbiotic Future will be held at Manly Art Gallery & Museum (MAG&M) on Thursday 10 September 2026 from 5.30 to 7.30pm.

Now in its third year, the Collective for Environmental Art & Design (CEAD) is a MAG&M initiative that melds art, design and environmental ideas through programs, partnerships, community activities and research. In previous years, this annual event has explored creative responses to climate change, collective action, biodiversity and sustainability in the art and design sectors.

Presented as part of the 2026 Environmental Art & Design Prize, the free discussion brings together a mix of leading creative, scientific and environmental voices. Andy Marks, founder and Executive Director of the Symbiocene Institute, will share insights into how symbiosis can help shape nature-positive decisions and inspire practical change. 

Acclaimed photo-media artist Anne Zahalka will bring more than 40 years’ experience exploring cultural and environmental points of tension and reflecting on the ecological impact of the global climate crisis.

They will be joined by Marnie Ogg, founder of the Australasian Dark Sky Alliance, whose work highlights the impact of light pollution on wildlife, people and the environment, and the importance of protecting natural nightscapes. 

Dr Jonathan Webb, ABC Radio National Science Editor and presenter of Lab Notes, will moderate the conversation, drawing on his experience to make complex environmental ideas engaging and accessible.

The panel will look at how art, design and science can help communities move beyond ideas of human impact and towards models of mutual exchange, interdependence and living in harmony with nature.

The 2026 theme, symbiosis, asks how people can build stronger relationships with the natural world and with each other, and how those relationships can support a more connected, sustainable and thriving future.

The event is framed by CEAD’s guiding principles: Act, Connect and Learn.

Event details

  • CEAD Panel 2026: Imagining our Symbiotic Future
  • Thursday 10 September 2026, 5.30–7.30pm
  • Manly Art Gallery & Museum
  • Free event. Bookings essential.

Gallery details / public information

  • Manly Art Gallery & Museum
  • West Esplanade Reserve, Manly NSW 2095
  • Open Tue – Sun, 10 am – 5 pm (closed Mondays & Public Holidays)
  • Free entry

Bookings and further information available here

Pittwater's Marnie Ogg. Image courtesy Marnie Ogg.

Horizontal Rainbow On Pittwater + Other Rainbows

Palm Beach artist Anne Spencer sent in the following a few weeks back, sharing:

''My horizontal rainbow photos at ground/sea level, which I took at Sand Point!!! - I sent these off to Prof Fred Watson - the answer back from Fred'':

“They’re definitely a rainbow, with a rain shower between you and the distant trees. The fact that it’s at ground level tells you that the Sun was directly behind you and 42 degrees above the horizon!”

Horizontal rainbows are rare optical phenomena and are a traditional rainbow formed by a low sun, but with a twist of perspective.

The Physics: Rainbow geometry dictates that the height of a rainbow's arc is inversely related to the height of the sun. If the sun is very low on the horizon behind you, so is the rainbow.

The Illusion: When a dark rainstorm cell forms a narrow curtain of water droplets over the open ocean or an estuary, the rainbow collapses visually. Because the horizon is flat and open, the arc appears exceptionally low, wide, and stretched horizontally across the water's surface, making it look like a glowing, flat ribbon.

Anne's pictures inspired a look at other kinds of Rainbows:

Rainbow Curtain

This is an ocean scene where a storm cloud opens at sunset and drops a glowing curtain of rainbow-colored rain toward the sea.

This effect happens when low sunlight hits falling rain, sea mist, or fine droplets inside the storm. The droplets bend and split the light into bright bands of red, yellow, green, blue, and violet. Because the rain is falling in vertical streaks, the rainbow color looks like it is pouring down from the cloud instead of forming a simple arc.

The warm sunset clouds make the colours even stronger, while the dark ocean below gives the whole scene a powerful storm-afterglow feeling.

A view like this fits tropical coastlines, open ocean horizons, island beaches, and stormy bays .. especially after heavy rain when the Sun breaks through low clouds near sunset. - Info/Photo: AstroNature

Circle rainbows - and Double Rainbows

Rainbows are actually complete 360-degree circles, but they look like arches from the ground because the horizon blocks the bottom half. Bernadette Kelly sent in this Double Rainbow photo she took at south Avalon Beach a few years back:

A double rainbow, or secondary rainbow, is caused by a double reflection of sunlight inside the raindrops, and are cantered on the sun itself. They are about 127° (violet) to 130° (red) wide. Since this is more than 90°, they are seen on the same side of the sky as the primary rainbow, about 10° above it at apparent angles of 50–53°. As a result of the "inside" of the secondary bow being "up" to the observer, the colours appear reversed compared to the primary bow. The secondary rainbow is fainter than the primary because more light escapes from two reflections compared to one and because the rainbow itself is spread over a greater area of the sky. Each rainbow reflects white light inside its coloured bands, but that is "down" for the primary and "up" for the secondary. The dark area of unlit sky lying between the primary and secondary bows is called Alexander's band, after Alexander of Aphrodisias who first described it.

A rainbow is an optical phenomenon caused by refraction, internal reflection and dispersion of light in water droplets resulting in a continuous spectrum of light appearing in the sky. The rainbow takes the form of a multicoloured circular arc. Rainbows caused by sunlight always appear in the section of sky directly opposite the sun. Rainbows can be caused by many forms of airborne water. These include not only rain, but also mist, spray, and airborne dew.

Rainbows when viewed from the ground typically appear as an illuminated arc, but when flying, if there is enough mist they can be seen as full circles. The centre of the curve is always on a line from the Sun to the observer's eye.

In a primary rainbow, the arc shows red on the outer part and violet on the inner side. This rainbow is caused by light being refracted when entering a droplet of water, then reflected inside on the back of the droplet and refracted again when leaving it.

In a double rainbow, a second arc is seen about 10° outside the primary arc. Its colours are perceived to be in reverse order, with red on the lower side of the arc.

Double rainbow and supernumerary rainbows on the inside of the primary arc. The shadow of the photographer's head at the bottom of the photograph marks the centre of the rainbow circle (the antisolar point).

Double rainbow and supernumerary rainbows on the inside of the primary arc. The shadow of the photographer's head at the bottom of the photograph marks the centre of the rainbow circle (the antisolar point). Photo: Eric Rolph 

Circular rainbow. Photo: Steve Kaufman 


Despite years of rain, Blue Mountains forests still haven’t recovered from the Black Summer megafires

Aftermath of blue mountains bushfire, landscape photo showing mountains and valleys with burned area in foreground
Brook Mitchell/Getty
Emily Simpson, University of Sydney; Aaron Greenville, University of Sydney; Chris Dickman, University of Sydney, and Glenda Wardle, University of Sydney

For three years before the Black Summer megafires of 2019–20, cool season rainfall in southeastern Australia was only half that of normal. When fires broke out, intensely dry conditions helped them spread through areas typically resistant to burning, such as wetlands and rainforests.

After the fires came three years of above-average rainfall, and scientific reports charted rapid vegetation regrowth.

It’s easy to think the rains let nature repair itself. But is that the full story? In our new research, we looked at what happened to seven severely burnt plant communities in the Greater Blue Mountains, west of Sydney.

We found a mixed picture. Wet sclerophyll forests supporting tall eucalypts skirted by ferns recovered within five years. But Blue Mountains rainforests did not recover from burns of any severity. Nor did grassy woodlands.

How can we track recovery?

To find out how well forests and other communities recovered from the Black Summer fires, we tracked recovery across the million-hectare Greater Blue Mountains World Heritage Area. Seven severe fires hit this region over the 2019–20 summer. The biggest was the Gospers Mountain fire, which burned an area seven times the size of Singapore – the largest fire from a single ignition point in Australia’s recorded history.

Five years on, if you had looked out across the Blue Mountains landscape you might have thought recovery was well under way. Thick scrub quickly replaced charred undergrowth in many areas. Across our study sites, many burned regions had denser understoreys – the layer of vegetation between forest floor and canopy – than unburnt areas.

But recovery isn’t just about how much vegetation is there. It’s about whether the layers of shrubs and canopy trees that make up a functioning plant community have returned to their previous state.

After fire moves through, some plant species rapidly regrow, outcompeting their rivals for light and water. But these species are often short-lived, failing to survive beyond a few years. On the other hand, species such as eucalypts and banksia may take years to regrow but then live much longer.

This means depending on when we take our measurements, we might mistake a temporary pulse of growth for real recovery.

To address this issue, our study tracked plant growth using a time-series of satellite images. This way, we could see the full trajectory of recovery, not just a snapshot.

A plant community that has fully recovered from burns will look stable year to year and mirror patterns of growth at unburnt sites. Poorly recovered areas, in contrast, will show distinct fluctuations.

We used this method to track recovery from low- to extreme-severity fire at 760 forest, heath and wetland sites in the Greater Blue Mountains region.

What did we find?

An earlier large-scale synthesis two years after the Black Summer fires found wet forests had suffered greater declines than drier plant communities.

Our findings five years after the fires tell a more complex story.

Some wet forests, such as wet sclerophyll, were able to take advantage of the heavy rains to recover fully within five years.

Others were less fortunate. The Blue Mountains are home to rare remnant rainforest, featuring stands of trees such as coachwood, lilly-pilly and sassafras, whose ancestors date back to Gondwana. We found these had not recovered after fires of any severity.

The region’s grassy woodlands also showed no sign of recovery when burned, despite being dry, open areas.

Why? We suggest the intense rains following Black Summer made it difficult for the community’s characteristic grasses and tussocks – adapted to dry conditions – to successfully re-establish.

What if the big dry hadn’t ended?

The years of heavy rain after the Black Summer fires were unusual. If drought had continued, would we have seen different recovery outcomes?

To tease out this question, we modelled what recovery would have looked like for plant communities under drought stress.

Simply put, all would be worse off. In particular, wet sclerophyll forests and freshwater wetlands showed declines five times greater than other plant communities.

This is likely due to the fact that the plant species in these ecosystems need heavy rainfall to re-establish. For instance, freshwater wetlands often need to be completely flooded for species to return.

These communities may be pushed to the point of collapse if drought persists after the next megafire.

What can we do?

Ferocious fires have swept through Europe in recent months and the southern summer is likely to coincide with a strong El Niño event, bringing a higher risk of intense heatwaves, drought and fire.

As climate change accelerates, these extreme conditions will become more common. To protect our plant communities, we must tailor our fire-management strategies. No two communities respond to fire the same way, and recovery outcomes differ greatly depending on whether post-fire conditions are hot and dry or cool and wet. A one-size-fits-all approach won’t work.

During the Black Summer fires, a team of firefighters protected the last wild stand of the ancient, fire-averse Wollemi pine in the Blue Mountains.

To help rainforests and other fire-averse plant communities survive, we will need technologies that help us rapidly detect and suppress new fires – and long-term monitoring programs to let us know when species are at risk.

In other landscapes, we must rethink our reliance on fuel-reduction burns. This is because plants are at higher risk of damage from fire if they have been frequently burnt in the past. When we repeatedly burn an area, we inflate this risk and condemn many plants and animals to staggering losses in future fires.

Of course, all these efforts won’t matter if we fail to tackle the underlying reason why fires are getting more frequent and severe – climate change.The Conversation

Emily Simpson, Doctoral Candidate in Ecology, University of Sydney; Aaron Greenville, Senior Lecturer in Spatial Agricultural and Environmental Sciences, University of Sydney; Chris Dickman, Professor Emeritus in Terrestrial Ecology, University of Sydney, and Glenda Wardle, Professor of Ecology and Evolution, University of Sydney

This article is republished from The Conversation under a Creative Commons license. Read the original article.


What happens next with bird flu? An expert explains why monitoring matters

King penguins on Macquarie Island, about halfway between Tasmania and Antarctica.
Samuel Bloch/Getty
John Woinarski, Charles Darwin University

The lethal H5N1 strain of avian influenza is rapidly spreading along the coast of southern Australia, where it has killed thousands of wild birds and infected at least two long-nosed fur seals.

So where will it travel next, and what damage might it inflict? Much is uncertain, especially because many of Australia’s animals and ecosystems are so unlike those in other parts of the world.

But monitoring is vital if we are to understand the magnitude of this H5N1 outbreak and protect our most vulnerable species, including the threatened Australian sea lion.

What may be coming

It’s difficult to know how Australia’s current H5N1 crisis will unfold. But we can make four predictions, based on existing knowledge.

Waterfowl will carry the virus inland

Infected waterfowl from coastal southern Australia – such as ducks, herons and swans – will soon carry H5N1 to inland wetland systems. The timing is terrible.

In coming months, the hot and dry conditions created by the El Niño climate pattern will cause those wetlands to shrink. This means vast numbers of waterfowl, already debilitated by scarce resources, will congregate at the few remaining water sources. Weak flow and high densities of dead and dying birds will turn this water into a virus-contaminated soup, leading to further losses.

Macquarie Island’s wildlife will suffer major losses

To date, the significant seabird, seal and king penguin colonies on Macquarie Island have escaped the virus. However, H5N1 has devastated similar colonies on many other subantarctic islands, such as Keguelon and Crozet Islands.

Macquarie’s luck will soon run out, leaving its densely packed colonies of penguins, seals and petrels extremely exposed. In response to this threat, the Australian government has evacuated researchers from the island to protect their physical and psychological health.

Shearwaters will be widely infected

Within a few weeks, vast flocks of shearwaters will return from their global migration to nest on islands off southern Australia, such as those in Bass Strait. Bird flu, likely carried by other seabirds, will await them there. Losses may be substantial.

Scavengers will carry the virus beyond the coast and wetlands

Foxes, roaming cats, mynahs and other scavenger animals will bring H5N1 to our cities. This will have far-reaching impacts on urban wildlife, such as magpies and possums, consistent with declines of urban species overseas.

There is hope

However, it’s not all doom and gloom.

Bird flu has not yet caused extinction of any species elsewhere in the world. And after the initial outbreak, some affected species have started to recover – in some cases because survivors have stronger immunological responses. This should happen in Australia too.

What is critical now is assessing the conservation impacts of H5N1 on our wildlife.

Counts of dead birds tell us something about the flu’s spread and virulence. But while every death is saddening, corpse tallies alone don’t reflect conservation impact.

For example, thousands of greater crested terns have been killed by H5N1, but these deaths represent a fraction of the global population, estimated to number between 150,000 and 1.1 million. In contrast, there are only about 3,000 Christmas Island frigatebirds in existence, so any losses would be disastrous for that population.

What’s more, counts of deaths can be unreliable as many corpses may never be discovered. Instead, governments should focus on the proportion of a species’ total population that is killed by bird flu. This will allow us to assess the conservation consequences and, over time, the extent of recovery.

Assessing impact is not always straightforward

However, population-level impacts may be challenging to assess.

We have good estimates of population sizes for only a few Australian animal species. Fortunately, this includes some species that are most vulnerable to H5N1, including colonial-breeding seabirds and seals.

Without this data, monitoring can be used to estimate population density at a series of sampled sites or the incidence of certain bird species. Some current monitoring programs, such as the long-running aerial survey of waterfowl across eastern Australia, could provide critical data about the impacts of bird flu.

Interpreting monitoring data can also be complex. In inland Australia, the numbers of many species bounce around, particularly when the weather fluctuates between being wet or dry. With this statistical “noise”, identifying any population declines caused by bird flu is difficult.

There are biases and gaps in monitoring data. Most native mammals are not monitored, so we may have no idea how many die from H5N1. Losses in birds found in remote areas, such as the Heard Island black-faced sheathbill, are also likely to be missed due to lack of regular monitoring.

Where to from here

To understand the nuanced impacts of H5N1 bird flu, monitoring should assess the effectiveness of management actions, changes in breeding success and levels of immunity, mutations and the virulence of the virus itself.

It should also investigate survival rates of infected individuals, the broader environmental risks of losing large numbers of key species and the extent of recovery. Recovery may be harder and take longer for species that have low breeding output and take many years to mature, such as albatrosses.

Without effective monitoring, we will not grasp the true magnitude or significance of the current H5N1 outbreak. It’s what we need to both target emergency responses to the most affected species and measure the extent to which our actions are actually helping.The Conversation

John Woinarski, Professor of Conservation Biology, Charles Darwin University

This article is republished from The Conversation under a Creative Commons license. Read the original article.

Bird flu could devastate Macquarie Island. Why are we removing the scientists we need to understand it?

A king penguin with a researcher in the background.
PhillDanze/Getty
Jane Younger, University of Tasmania; Amandine Gamble, Cornell University, and Augustin Clessin, Université de Montpellier

Australia’s Macquarie Island lies deep in the Southern Ocean, about 1,500 kilometres southeast of Tasmania. This World Heritage-listed sanctuary is a haven for species such as elephant and fur seals, penguins, albatrosses and petrels, and a key site for wildlife researchers.

But it is not safe from H5N1 bird flu. This lethal virus is rapidly spreading across the Australian mainland and Southern Ocean, already hitting other sub-Antarctic islands including Heard Island.

However, the Australian government has decided to withdraw all 24 expeditioners – including scientists, tradespeople and support staff – from the site. It says this is mainly to protect them from the psychosocial risks – the psychological harms of working in stressful or traumatic conditions – associated with living through a potential H5N1 outbreak and the wildlife casualties it may cause.

Those risks are real. Witnessing mass wildlife deaths could be deeply distressing for any person. But taking everyone off the island means the scientists who work there cannot document an outbreak as it unfolds, or understand what is happening to wildlife populations we have studied for decades.

At Macquarie, monitoring is vital

Scientists have worked at Macquarie Island for more than 70 years, and withdrawing all personnel will disrupt long-term wildlife, climate, atmospheric and geological monitoring, well beyond the bird flu response.

For southern elephant seals, the stakes are particularly high. The species is considered “vulnerable” on the IUCN Red List and under Australia’s Environment Protection and Biodiversity Conservation Act. Decades of monitoring show numbers of breeding females at Macquarie’s major colony have fallen sharply, dropping from 9,400 in 1949 to 2,550 in 2023. The federal recovery plan for this species identifies disease outbreaks as a threat and calls for regular, scientifically robust monitoring.

Bird flu is precisely this type of threat.

At Australia’s Heard Island, more than 13,000 elephant seal pups died during a recent H5N1 outbreak, while the number of breeding females fell by almost half at monitored sites on Britain’s South Georgia. The Australian Antarctic Division itself identified the need for 2026-27 population data to assess the impact of bird flu on Macquarie Island. But the government has now reversed course in withdrawing the island’s staff.

Six king penguins show interest in a nearby group of male elephant seals resting on a black-sand beach at Macquarie Island.
King penguins and elephant seals are just two species found on the wildlife-rich Macquarie Island. © Bruce Mitchell 2010/Getty

Psychosocial risk is real

Psychosocial or ecological grief – distress associated with the loss of species and places people care about – is well documented among conservation professionals.

But avoiding exposure to loss isn’t the only answer. Guidance from the World Health Organisation emphasises preparation, training and dedicated mental health and psychosocial support for personnel working in difficult emergency environments.

Other nations have already faced this problem. At other sub-Antarctic islands such as South Georgia, Crozet and Kerguelen and the Falklands, authorities boosted biosecurity measures – including providing personal protective equipment and guidance on wildlife sampling – to maintain essential science and disease surveillance. Similarly, the international Scientific Committee for Antarctic Research Action Group on Wildlife Health recommends assessing which activities should continue during outbreaks and outlines appropriate protective measures.

This raises important questions about how Australia reached its decision. Did the government seek advice from other programs that have successfully monitored outbreaks? Could a smaller specialist team remain with additional training, shorter deployments and dedicated psychological support?

The government hasn’t indicated what the long-term plan will be. Bird flu may not arrive this summer. Elsewhere in the Southern Ocean, outbreaks have recurred across multiple years. If the virus arrives next year or stretches over several years, will expeditioners be withdrawn indefinitely?

A researcher stands in a bleak-looking landscape on South Georgia, an island in the South Atlantic ocean.
Biological sampling during the recent H5N1 outbreak at South Georgia. Jane Younger

Can cameras replace scientists?

After Australia’s personnel leave, the government may rely on live cameras, drones and satellites to monitor Macquarie Island. These tools will be useful. At Heard Island, drones were invaluable for measuring the enormous scale of mortality.

But remote monitoring cannot replace biological sampling. A camera cannot swab a freshly dead pup, collect blood from a surviving animal or conduct a postmortem.

Across Crozet, Kerguelen, Heard, South Georgia and the Falkland Islands, scientists sampled dead and apparently healthy wildlife during major outbreaks. These samples confirmed infections, detected antibodies in survivors and enabled viral sequencing. In our recent research, 104 new virus genomes collected across six sub-Antarctic and Antarctic locations allowed us to map transmission over thousands of kilometres and show how the virus continues to evolve, including adapting to mammals.

Without field samples, we lose crucial information about how the virus is evolving and spreading, limiting our ability to anticipate what happens next.

Three royal penguins walking on the beach at Macquarie Island, an island located in the Southern Ocean.
Royal penguins are endemic to Macquarie Island, where they live in large colonies. Richard McManus/Getty

Remote should not mean out of sight and out of mind

Surveillance, testing and reporting have been a top priority in our bird flu response on the Australian mainland. It should be no different on Macquarie Island, even though it is a remote location.

We cannot stop animals from dying if the lethal virus strain arrives. But we can understand which species are affected, which animals survive and where the virus may travel next.

We have monitored Macquarie’s declining elephant seal population for decades. We should not avert our eyes now.

We say this as scientists who have studied bird flu outbreaks and witnessed devastating wildlife losses firsthand. We are prepared for the difficult reality of studying wildlife disease. But what is much harder to accept is being forced to look away when science could still make a difference.The Conversation

Jane Younger, Senior Lecturer in Southern Ocean Vertebrate Ecology, Institute for Marine and Antarctic Studies, University of Tasmania; Amandine Gamble, Assistant Professor, Department of Public and Ecosystem Health, Cornell University, and Augustin Clessin, PhD Candidate, Centre d'Ecologie Fonctionnelle et Evolutive, Université de Montpellier

This article is republished from The Conversation under a Creative Commons license. Read the original article.


Your house may be a haven for wildlife. It’s time we design homes with nature in mind

Close-up of a wombat walking away from the bottom of a house.
Tommy Chan/Getty
Bethany Kiss, The University of Melbourne and Sarah Bekessy, The University of Melbourne; RMIT University

Ever found a bare-nosed wombat napping under your house or heard a possum thumping around in your roof?

You’re not alone. Data from Wildlife Victoria reveals that about 2,400 native animals were reported by people as being in, on or under buildings over the past decade.

For our new study, we analysed these reports to find out which animals were taking up residence in buildings, which parts of dwellings they occupied and what they were doing there.

We uncovered 36 native species that either nest, forage or sleep in our homes, ranging from microbats sleeping in curtains to pacific black ducks nesting on balconies. These encounters show buildings have become de facto habitat for many animals with whom we share our cities.

As Australia races to build more houses, we must design them with at-risk animals in mind. Their survival may depend on it.

Unexpected residents

Our new research reveals wildlife use almost every part of buildings.

Building cavities are the most popular option, with 40% of studied species taking up residence between walls. We found 19% of animals in shelters and structures such as garages and 16% in external surfaces such as eaves, balconies and tops of roofs.

About 10% of animals were found living in interior rooms like bedrooms and kitchens, 9% in spaces under houses and 6% in utility services such as heaters and air conditioners.

These building features often serve similar functions to natural habitats. Roof and wall cavities replicate the conditions of tree hollows. Spaces under houses resemble sheltered ground or burrows. Balconies provide elevated ledges that act as cliff edges. Aircon and water heaters can become ideal microclimates for reptiles.

A mother and baby possum hiding in the roof of a shed.
A mother and baby possum hiding in the roof of a shed. Pleio/Getty

The habitat gap

Buildings are becoming increasingly important for conservation, as natural habitats rapidly disappear from our urban landscapes.

Natural features such as tree hollows – on which more than 300 Australian native species depend – can take centuries to form. Research shows the number of large, hollow-bearing trees in urban areas is declining. And replacement saplings won’t grow and provide habitat for a very long time.

Ecologists are working to address this gap by developing nest boxes, carved hollows, bee hotels and other creative solutions.

Relying on buildings for habitat is precarious. A renovation or repair can erase it overnight. Exclusion – using physical barriers or devices to keep wildlife out of buildings – may be necessary if an animal poses a genuine health, safety or welfare risk. This is best done by an expert wildlife carer.

The problem is not exclusion itself. Rather, it is the act of excluding an animal and removing its shelter without considering other safe alternatives. This approach will only exacerbate Australia’s extinction crisis.

Our research suggests there’s another largely overlooked way to protect our most vulnerable animals: adapting our houses.

Four grey ducks stand on a concrete ledge.
Pacific black ducks are one species that may take up residence in your home. WadeMachin/Getty

Homes as habitat

Australia has a national target to build 1.2 million homes over the next five years.

Constructing a new home involves making many decisions, from where roof cavities will go to whether precious soil is concreted over. Together, these choices shape whole neighbourhoods, including whether they contain vital habitat or force local species to go elsewhere.

Meanwhile, Australia is strengthening standards around the energy efficiency of houses. For example, new builds must be properly sealed to limit air leaks, which account for between 15–25% of heat lost from homes in winter.

However, an energy-efficient home does not need to be a wildlife-free place. Habitat features can be weaved into house designs.

A concrete nesting box for birds, mounted on a brick wall.
A swift nesting box mounted on the brick wall of a house. Richard Newstead/Getty

In Scotland, regulations require new buildings to have “swift bricks”, a type of nest box that can be installed in external walls as habitat for the common swift (Apus apus) population.

In Germany’s Brantstrasse building, designers have included swift bricks, bat boxes and hedgehog nest boxes in the actual structure. These approaches show adapting buildings for wildlife can be easy and effective.

Australia currently has no such policy. But several grassroots initiatives are emerging such as wildhouses, where builders fund one standalone bird, bat or glider nest box for every building they construct.

Urban designers and planners are increasingly designing cities with wildlife in mind. This approach, known as biodiversity sensitive urban design, aims to construct urban environments that minimise threats to plants and animals while accommodating their resource needs.

For example, a new suburb may decide to plant flowering meadows instead of lawn in streetscapes and parks. Both Canberra and Adelaide have adopted this approach in policy.

Where to from here?

Adapting buildings for wildlife must be based on robust ecological research. Certain features such as bird spikes, netting and reflective glass are designed to keep wildlife out. This so-called “hostile architecture” can wound and even kill animals.

In some cities, the design of buildings may favour a handful of urban-adapted species. In Melbourne, for example, a lack of suitable habitat for smaller forest birds such as fairy wrens and yellow robins means they are rapidly being pushed out by aggressive noisy miners.

Cities should not be places where concrete simply replaces nature. Research suggests urban areas will become increasingly important to tackling the extinction crisis. Australia urgently needs more homes. But in our rush to build them, we must not neglect the needs of the vulnerable animals that may have nowhere else to go.The Conversation

Bethany Kiss, PhD Candidate, Faculty of Science, The University of Melbourne and Sarah Bekessy, Professor, Urban Ecology and Biodiversity, The University of Melbourne; RMIT University

This article is republished from The Conversation under a Creative Commons license. Read the original article.

Appin Road underpass for Wildlife finally opened

On Wednesday September 2 2026 the NSW Government announced that, with koala breeding season now underway and wildlife activity set to increase through the warmer months, a new wildlife underpass at Noorumba Reserve is finally open, giving koalas and other native animals a safer way to cross Appin Road in Sydney’s South West.

The purpose-built koala underpass had been left half-built for over a year due to a disagreement between developers; Stockland said it needed access to land owned by Lendlease on the eastern side of Appin Road to complete the koala underpass, but had not been given permission. 

Stockland was to deliver Glen Lorne and Beulah koala underpasses after it purchased the Figtree Hill Estate from Lendlease in November 2024 as part of broader acquisitions. 

However, work on the half-built Glen Lorne koala underpass near Noorumba Reserve stalled over the land dispute.

Meanwhile, koalas and other wildlife continue to be killed on the road.

This was one of three koala underpasses planned for the road where, according to the Sydney Basin Koala Network and NSW Bionet, more than 207 koalas have been killed by vehicles since 2021. The road cuts through a generational food and breeding path for the koalas. Calls for the State Government to step in and resolve the dispute did not hasten the protracted delay.

Save Sydney's Koalas stated in September 2021: ''The well documented Menangle Creek - Noorumba Reserve koala habitat corridor is essential to the koalas’ survival because it’s the shortest route between the two rivers and allows them to move west to the Blue Mountains to cross breed.

Remarkably this colony escaped the Black Summer bushfires; and it is now the only colony still expanding in NSW (NSW Legislative Council’s Koala Inquiry 2020, MacAlpine 2015, Draft National Koala Recovery Plan 2021). Therefore it has become ‘critical’ to the future of the state's koala population.''

In 2019 Campbelltown Council approved removal of habitat while the previous government adopted a translocation policy for the koalas to forward developers plans for the area.

See: 

Image: Location of all koalas hit by cars on Appin Road since 1st Jan 2021, as of October 2024: Sydney Basin Koala Network map

The 52-metre-long underpass is the first of three planned along Appin Road, allowing wildlife to pass beneath the road keeping animals and motorists safely separated.

The new underpass has been designed to accommodate large animals such as kangaroos and wallabies, while logs, habitat features and native vegetation encourage smaller species including koalas, possums and native rodents. Drainage has also been incorporated to keep the underpass accessible during wet weather.

The government states the underpass is supported by approximately three kilometres of koala exclusion fencing along both sides of Appin Road, complemented by eight koala grids at driveway points, 11 one-way escape hatches and seven escape poles to help koalas safely return to habitat if they find themselves on the road-facing side of the fence.

''More than 40,000 native plants have been planted throughout the corridor, along with a fauna rope crossing to support wildlife movement.

The underpass is being monitored to understand how it complements existing protection measures and further improves koala safety and habitat connectivity.'' the government stated this week

''It builds on measures already delivered by the Minns Labor Government to protect koalas and other threatened species in the wild across Sydney’s South West, including:

  • Installing exclusion fencing that has seen an 80 per cent reduction in koala strikes along the fenced section of Appin Road
  • Creating two new national parks covering more than 2,000 hectares of critical koala and other threatened species habitat at Warranmadhaa National Park and Gulguer National Park
  • Granting more than $460,000 to Wollondilly Shire, Liverpool City and Campbelltown City Councils for warning signs to prevent koalas being hit by cars
  • Investing $4.5 million in a new koala care centre in the Macarthur region
  • Providing $500,000 to support volunteer rehabilitators in the Macarthur area
  • $1.9m for Transport for NSW to construct fauna access structures on both sides of Deadmans Creek Bridge, a known koala vehicle strike hotspot

The new underpass forms part of Stage 1 of the Appin Road upgrade around Figtree Hill, which has also delivered around 500 metres of road upgraded from one to two lanes in each direction on separated carriageways. Around 10,000 vehicles use this section of Appin Road each day. The upgrade improves safety and access for the rapidly growing Figtree Hill community.

The government also stated this week that work is continuing to strengthen koala protection along the Appin Road corridor with a second underpass planned for the Beulah BioBank site and construction of a third underpass at Ousedale Creek near Brian Road expected to start later this year. New koala protection fencing will also be installed, providing a single corridor of protection from south of Rosemeadow to just north of Appin Road township.

Construction is also continuing for koala protection measures along Heathcote Road around Deadmans Creek, with work expected to be complete by end of the year, weather permitting, the government stated

For more information on the Appin Road works, visit: Appin Road upgrade

Minister for the Environment, Penny Sharpe said:

“The new underpass, together with fencing and other protection measures will make a real difference in keeping koalas safe from the road when they move between their habitats.

“It’s another practical step by the Minns Labor Government’s in securing the future of koalas in south-west Sydney.”

Minister for Roads, Jenny Aitchison said:

“Australians are incredibly lucky to live in a country where spotting a koala, kangaroo or other native wildlife is not a rare-sight, but part and parcel of living here. We treasure this wildlife, and its preservation is non-negotiable.

“Ahead of koala breeding season kicking off in September, this underpass and other fencing is going to play an essential role in ensuring koalas and other animals are able to move through the wild safely.

“I'd also remind motorists to stay alert at dusk and in the evening, when animals are most active — just as we look out for each other on the roads, we need to extend that same care to our native wildlife.”

The Sydney Basin Koala Network stated on Thursday, September 3:

''The community was always fighting for an overpass at this location. Transport for NSW said no. 

Revegetation is currently a major barrier to use, both at the underpass location and in the promised corridor past Noorumba Reserve. There are koalas in Noorumba, they have not found this underpass yet, and recent rescues in both Figtree Hill and Rosemeadow indicate that the fencing between the reserve and houses has major issues also. The housing development should not have proceeded until these issues were resolved yet here we are.''

Glen Lorne koala underpass near Noorumba Reserve finally opened. Photos: NSW Government

NSW Landholders delivered clarity for managing native vegetation: NSW Government

Announced: Monday August 31 2026

Landholders across the state will have greater certainty about how native vegetation rules in NSW apply to their properties, with the NSW Government publishing the Native Vegetation Regulatory (NVR) map today, Monday 31 August.

The map, published under the Local Land Services Act 2013, marks the end of the transitional mapping period and provides a single, authoritative view of where native vegetation rules apply across rural NSW.

The publication of the map allows the NSW Government to replace temporary arrangements that have been in place since 2017 with a clearer and more transparent system.

Importantly, the NVR map does not create new restrictions on landholders' ability to manage their land. Instead, it provides a clear, up-to-date map showing where existing native vegetation management rules apply and what management pathways are available.

Many landholders currently undertake self-assessable clearing activities on Category 2 Regulated Land using a transitional arrangement that does not require Local Land Services (LLS) to be notified.

Under the new arrangements, landholders will still be able to undertake eligible self-assessable clearing activities. The only notable change is that they will be required to notify LLS at least 14 days before clearing begins, improving reporting of where clearing activities are occurring across NSW.

Now that the map has been published, these notification requirements can take effect, providing greater transparency and making it easier to distinguish lawful clearing from potentially unlawful clearing.

Landholders can view the land categories online or through the Check My Land NSW app to better understand management options available on their property.

The NVR map will apply across rural NSW, except in the Bland Shire Council and Temora Shire Council areas, where existing mapping arrangements will remain in place while the NSW Threatened Species Scientific Committee completes a specific independent review.

This approach honours commitments made to local landholders while the review is undertaken.

Now the map is published, landholders can continue to request a free map review and category explanation report by contacting the Map Review Team on 1800 001 490 or emailing map.review@environment.nsw.gov.au.

Landholders can contact their local LLS office to discuss the changes and management options available under the native vegetation management code.

For more information visit Native Vegetation Regulatory map or download the Check My Land NSW app.

Anthony Lean
Secretary
Department of Climate Change, Energy, the Environment and Water 

El Niño set to become very strong, raising risks of extreme weather into 2027: World Meteorological Organization (WMO)

September 3, 2026

El Niño is firmly established and will intensify into a very strong event in the coming months, with big impacts on rainfall and temperature patterns and associated risks of floods, drought and extreme heat, according to a new update from the World Meteorological Organization (WMO). 

Forecasts from WMO’s Global Producing Centres indicate an “exceptionally high likelihood of nearly 100%” that El Niño will persist through to February 2027. This is the first time that a WMO El Niño/La Niña Update has been so unequivocal, reflecting the strong agreement within WMO’s extensive network.

Fuelled by exceptionally warm ocean conditions across the tropical Pacific, El Niño is expected to strengthen further during the coming months to a very strong intensity before peaking towards the end of this year, with climate impacts continuing well into 2027.

“El Niño is being supersized before our eyes. The science leaves no room for doubt: the planet is in uncharted waters, and those waters are heating up. Sea surface temperatures are rising, temperatures keep climbing, and the world is in the danger zone of extreme weather. The race now is between rising risks and our commitment to take climate action and protect people. We must win that race,” said UN Secretary-General António Guterres

“El Niño in Spanish means boy child – but it has the potential to deliver a massive blow to communities and economies across the world. We are already seeing disruption and devastation from droughts and floods and we expect these impacts to increase as El Niño intensifies,” said WMO Secretary-General Celeste Saulo.

“This exceptional El Niño demands exceptional preparation and response. Never before in the 50-year history of the World Meteorological Organization have we launched such a major mobilization with National Meteorological and Hydrological Services who are on the frontline of delivering the forecasts and services to save lives and livelihoods,” she said.

“WMO is committed to working closely with partners across the United Nations and humanitarian system to provide the climate intelligence and insights needed to support disaster management and climate-sensitive sectors like agriculture, health, energy and water resources,” she said.  “We have no time to lose.”

WMO El Niño/La Niña Updates are the world’s most authoritative source of information for governments and decision-makers. These seasonal forecasts are based on a consensus of models from WMO Global Producing Centres, experts from National Meteorological and Hydrological Services and climate prediction centres around the world.

Exceptional ocean heat in the tropical Pacific  

Sea surface temperatures across the central-eastern equatorial Pacific, the region at the heart of El Niño, are already well above average – one of the tell-tale signs of El Niño – and are continuing to rise.

The widely used Niño 3.4 index, which measures sea surface temperature anomalies in central-eastern equatorial Pacific has strengthened markedly from an average +1.5 °C above normal during May-July 2026 and +2.0 °C above normal in July. Weekly values subsequently increased further between late July and mid-August, ranging from approximately +2.2 °C to +2.6 °C above average, indicating continued intensification.

Even more exceptional warmth is present below the ocean surface. In some areas, subsurface ocean temperatures were more than 8°C above average during July and early August.

Together, the surface and subsurface ocean conditions provide strong support for continued El Niño conditions and the potential for further strengthening during the coming months, the Update says.

Confidence in the outlook is high. Strong and mutually reinforcing oceanic and atmospheric signals, together with close agreement among seasonal prediction systems indicate that El Niño will persist at least into early 2027.

Very Strong El Niño does not mean the same impacts everywhere

El Niño and La Niña are among the most powerful naturally occurring influences on the global climate system. A very strong event increases the likelihood of major changes in rainfall, temperatures and atmospheric circulation across many regions of the world.

However, the strength of an El Niño event alone does not determine how severe its impacts will be in any individual country or region.

Its effects vary according to location and season and can be modified by other climate drivers, including conditions in the Indian and Atlantic Oceans.

WMO has therefore issued a complementary Global Seasonal Climate Update, which  brings together information about El Niño and other major climate drivers, enabling a more refined picture of expected conditions.

For September–November 2026, WMO multi-model forecasts indicate an increased likelihood of above-normal temperatures across almost all land areas, alongside rainfall patterns showing a pronounced and classic atmospheric response to the strong Pacific El Niño.

A positive phase of the Indian Ocean Dipole (IOD) is also expected to develop, reaching a September-October-November 2026 seasonal mean value of 0.9°C. Meanwhile, the equatorial Atlantic basin is forecast to remain generally warm, with SSTs in both the North and South Tropical Atlantic staying above normal.  These conditions may reinforce, weaken or alter typical El Niño impacts in different regions.

Probabilistic forecasts of surface air temperature and rainfall for the season September-November 2026. The tercile category with the highest forecast probability is indicated by shaded areas. The most likely category for below-normal, above-normal, and near-normal is depicted in blue, red, and grey shadings respectively for temperature, and yellow, green and grey shadings respectively for rainfall. White areas indicate equal chances for all categories in both cases. The baseline period is 1993–2009. (Source: The WMO Lead Centre for Seasonal Prediction Multi-Model Ensemble) Graphics: WMO

More detailed and locally applicable information is provided through WMO Regional Climate Centres, WMO Regional Climate Outlook Forums and National Meteorological and Hydrological Services.

Turning forecasts into early action

El Niño and La Niña are opposite phases of the El Niño–Southern Oscillation (ENSO); one of the most powerful naturally occurring climate patterns on Earth.

El Niño is characterised by a warming of ocean surface temperatures in the central and eastern Equatorial Pacific. It typically occurs every two to seven years and lasts around nine to twelve months.

El Niño generally begins developing between March and June and reaches its peak intensity between November and February.  Its impact on global temperatures can extend beyond the period of peak ocean warming and be most pronounced in the year after development.

Because El Niño can reshape weather and climate patterns thousands of kilometres away from the tropical Pacific, reliable forecasts provide governments, humanitarian agencies, businesses and communities with valuable time to prepare.

WMO Members and partners will therefore continue to closely monitor the evolution of the event and regularly update forecasts of its likely regional impacts.

National Meteorological and Hydrological Services remain the authoritative source of official warnings and locally relevant climate information. 

El Niño is a natural climate phenomenon and is not caused by climate change.

The WMO El Niño/La Niña Update is prepared through a collaborative effort between the WMO and Center for Climate Systems Research (CCSR) / International Research Institute for Climate and Society (IRI) Columbia Climate School, USA, and is based on contributions from experts worldwide, inter alia, of the following institutions: Australian Bureau of Meteorology (BOM), Centro Internacional para la Investigación del Fenómeno El Niño (CIIFEN), China Meteorological Administration (CMA), Climate Prediction Centre (CPC) and Pacific ENSO Applications Climate (PEAC) Services of the National Oceanic and Atmospheric Administration (NOAA) of the United States of America (USA), European Centre for Medium Range Weather Forecasts (ECMWF), Météo-France, India Meteorological Department (IMD), Indian Institute of Tropical Meteorology (IITM), International Monsoons Project Office (IMPO), Japan Meteorological Agency (JMA), Korea Meteorological Administration (KMA), Met Office of the United Kingdom, Meteorological Service Singapore (MSS), WMO Global Producing Centres of Seasonal Prediction (GPCs-SP) including the Lead Centre for Seasonal Prediction Multi-Model Ensemble (LC-SPMME).

Since the 1980s, the dominant approach to measuring or identifying El Niño has been the use of the Oceanic Niño Index wherein scientists calculate the Sea Surface Temperature Anomaly in a specific region of the Pacific called the Niño 3.4 region.

When computed over a three-month average, this becomes the Oceanic Niño Index (ONI). In recent years and with global warming, a newer metric of measurement called the Relative Oceanic Niño Index (RONI) has gained ground. This approach measures relative warming, not just absolute warming, helping scientists assess whether a warming event is ENSO-driven or mostly due to global ocean warming.  

The World Meteorological Organization is the United Nations System’s voice on Weather, Climate and Water.

IPART Review of the water pricing framework for NSW data centres: Have your say on terms of reference

Have your say on our Draft Terms of Reference

The NSW Government has issued IPART a Draft Terms of Reference to review the water pricing and regulatory framework for data centres.

IPART is seeking feedback from all interested stakeholders on the scope of our review and the matters set out in the Draft Terms of Reference.

The review would recommend a framework for how data centre operators fund the upfront and ongoing costs of providing water services to them. Once the Terms of Reference are finalised, we will commence the full review and consult further with all stakeholders throughout that process.

Submissions on the Draft Terms of Reference close on 2 October 2026.

You can read the Draft Terms of Reference and IPART's Fact Sheet, and make a submission via the IPART website.

In preparing its advice, IPART is to consider the following matters:

1. Forecast capital and operating costs of connecting data centres to metropolitan water services

2. Demand risks of connecting large, high-intensity water users to existing supply sources and the impact on existing and future water customers

3. Supply augmentation costs and how these are allocated between data centres, existing and future water customers, and any other parties (including consideration of stranded asset risk)

4. Service levels required by data centres and how they differ from other large water users

5. The water security requirements of data centres and how these might be addressed in a regulatory and pricing framework

6. Safeguarding long-term water security (including drought management/water restrictions)

7. Incentivising data centres to optimise their use of water with energy consumption implications

8. NSW’s competitive position in attracting new investment and the broader economic benefits to NSW that data centres may provide including jobs, and investment in skills and innovation

9. A regulatory framework that provides for competitive neutrality for the different suppliers of water services (public water utilities, and Water Industry Competition Act 2006 licensees)

10. The approaches in other equivalent jurisdictions, as relevant.

11. Any other relevant legislative, policy, or environmental considerations that IPART considers may affect the water pricing and regulatory framework’s application to data centres.

The Factsheet states there will be additional opportunities to provide feedback during the review once IPART receive the final Terms of Reference from the NSW Government. 

IPART Webpage for consultation: www.ipart.nsw.gov.au/review/water/review-water-pricing-framework-data-centres

Background in August 2026 report: Framework for NSW Data Centres Released

Proposed classification of proposed public land at Seaforth under Section 34 of the Local Government Act 1993: NBC Notice

Tuesday, 25 August 2026

In accordance with Section 34 of the Local Government Act 1993, the Northern Beaches Council hereby gives public notice of its intention to classify the land described below as Community Land.

  • Address: Rignold Street, Seaforth
  • Legal Description: Lot 1 DP 23224, Lot 3 DP 23224, Lot 4 DP 23224, Lot 5 DP 23224
  • Area: 9,244 square metres
  • Current Classification: Not classified
  • Proposed Classification: Community Land

Northern Beaches Council is proposing to acquire the subject land for public open space purposes and, if acquired, to classify it as Community Land, subject to a resolution of Council.

Submissions

Written submissions regarding the proposed land classification may be made to Council within 28 days of the date of this notice by:

Completing the submission form on Council's website

Emailing council@northernbeaches.nsw.gov.au

Writing to Northern Beaches Council, PO Box 82, MANLY NSW 1655

All submissions received during the public notice period will be considered, and a further report will be presented to Council to determine the proposed classification of the land.

Submissions close 22 September 2026

Government unveils plans for Cammeray Parklands

Announced: September 2, 2026
The NSW Government has today revealed plans for a vibrant new green space on Sydney’s lower north shore for the community to relax, play and connect with nature in Cammeray.

The land, which is currently being used as a construction site for the Western Harbour Tunnel project, will be transformed into the new Cammeray Parklands after construction is complete.

The Government has released the draft design for the new Cammeray Parklands, giving the community the opportunity to help shape the future of the site, which sits between the Warringah Freeway and Cammeray Golf Course.

Plans for the new parklands include:
  • Large open lawns
  • Native Australian gardens
  • Accessible shared paths, linking existing active transport routes including the upgraded Ernest Street Bridge
  • A multi-use half court suitable for basketball and pickleball
  • A small synthetic turf sports area
  • An outdoor fitness station
Work on the parklands will commence once the land is no longer required for construction of the Western Harbour Tunnel, which is due to open to traffic in 2028.

Once open, North Sydney Council will manage and maintain the parklands.

Community feedback gathered throughout the planning and delivery of the Western Harbour Tunnel has helped inform the draft Place, Design and Landscape Plan, which has been further developed in close consultation with North Sydney Council.

The draft Cammeray Parklands Place, Design and Landscape Plan will be on public exhibition from Monday 24 August (TBC) to Sunday 11 September (TBC) 2026.

Community members can view the draft design and provide feedback during the exhibition period via the Transport for NSW website at: caportal.com.au/rms/wht/pdlp-part-3

Feedback can also be provided by visiting the Community Information Centre at Level 9, 60 Miller Street, North Sydney, from Monday to Friday between 9am and 5pm, or by contacting the Western Harbour Tunnel project team by email.

Artist’s impression of the lower parklands and the existing shared path (trees and landscape indicatively shown at maturity)

Revamped lookout to deliver panoramic views across Western Sydney

The Minns Government has unveiled designs for a revamped lookout in Western Sydney which would provide a destination for walkers, runners and cyclists and great open space where visitors can gather, relax and enjoy natural beauty.

The plans look to transform ‘The Beauty Spot’ in Cecil Park which already offers spectacular panoramic views across the Sydney Basin to the Blue Mountains, creating a unique visitor experience within Western Sydney Parklands.

Located 40 kilometres from Sydney's CBD within Liverpool's LGA, ‘The Beauty Spot’ is one of the region's highest natural viewpoints at 149 metres above sea level.

The community is invited to 'have a say' on the plans which include an open viewing platform located on the ridgeline, allowing visitors to experience the landscape from multiple perspectives.

The draft concept design will be delivered in stages by the NSW Government and has been designed to complement the site's natural topography and open grassland character while showcasing Western Sydney's best views.

Stage 1 will deliver the lookout, pathways, seating, native landscaping and viewing areas with construction expected to begin in late 2026 and be completed mid-2027.

Future stages will incorporate shade structures and opportunities to celebrate First Nations culture through integrated interpretation and storytelling within the lookout. They will also explore opportunities to expand The Beauty Spot Lookout into a broader visitor destination, with improved access and entry points, visitor parking, amenities, shelters and spaces for gathering and recreation.

The project is part of Greater Sydney Parklands' Southern Parklands Framework, a long-term vision to enhance recreation, visitor experiences and connections to nature across the southern precinct of Western Sydney Parklands. Community feedback on the draft concept design is open from 31 August to 27 September at greatersydneyparklands.nsw.gov.au/beautyspot

Minister for Planning and Public Spaces Paul Scully said:

"This revamped lookout will celebrate the unique landscapes and expansive views of Western Sydney already offered by the Beauty spot.

"With this work we want to unlock the Beauty spot’s full potential so that it is a place where people can gather, relax and enjoy natural beauty.

"This is part of the Minns Labor Government’s long-term vision for the Southern Parklands, creating places that support community wellbeing, encourage active lifestyles and strengthen connections with Country."

Member for Leppington Nathan Hagarty said:

“South Western Sydney is growing quickly, and our investment in The Beauty Spot will give local families another great place to get outdoors and enjoy what our region has to offer.

“Whether you’re walking, running, cycling or spending time with family and friends, this lookout will open up some of Western Sydney’s most spectacular views for more people to experience.

“As our communities grow, we’re making sure quality parks, open spaces and recreation opportunities grow with them, so people can enjoy them close to home.”

Greater Sydney Parklands Chief Executive Joshua French said:

“As Western Sydney continues to grow, The Beauty Spot Lookout provides another opportunity to get outdoors and explore the natural beauty of Western Sydney Parklands.

"The design creates an open and expansive lookout experience along the ridgeline, encouraging visitors to slow down, immerse themselves in the landscape and take in the changing views across Western Sydney and towards the Blue Mountains."

Explore the draft proposal and have your say by Sunday 27 September 2026 via the online submission form here: www.greatersydneyparklands.nsw.gov.au/beauty-spot-lookout

Image: Artists concept picture of Stage 1 works at Beauty Spot Lookout lookout in Cecil Park within Western Sydney Parklands

Public comment opens on industrial port and dredging proposal threatening Exmouth Gulf-Ningaloo

  • WA EPA has released Gascoyne Gateway’s environmental review documents for its proposed industrial port in Exmouth Gulf for public scrutiny. 
  • AMCS-Protect Ningaloo is campaigning to stop the port that would attract shipping through a critical humpback whale resting and nursing ground, require extensive dredging and cause other wide-ranging impacts.
  • Exmouth Gulf, Ningaloo will become WA’s newest marine park and is under formal assessment for National Heritage listing – AMCS-Protect Ningaloo maintains that an industrial port would be entirely incompatible with these vital conservation measures.

Australians have 12 weeks to voice their concerns about the industrialisation of Exmouth Gulf after Western Australia’s Environmental Protection Authority (EPA) today released the Environmental Review Document for Gascoyne Gateway’s port proposal for public comment. Submissions close 16 November 2026.

The Australian Marine Conservation Society states the proposal poses such widespread potential impacts to matters of national environmental significance that it has also triggered a federal assessment that will be part of this public comment period.

Gascoyne Gateway wants to build an industrial port 10km south of Exmouth town next to Qualing Pool – a rare freshwater oasis that the WA Government has earmarked as a class A nature reserve. The port would attract large vessels including fuel tankers, cargo ships, cruise liners and other heavy shipping into Exmouth Gulf, which the WA Government has earmarked for a marine park and which is under formal assessment by the Australian Government as a National Heritage treasure. 

This ecologically rich marine and coastal area is closely linked to the World Heritage-listed Ningaloo Coast and holds high conservation value. The area is home to many threatened and listed species, including dugongs, turtles, manta rays, sea snakes and dolphins, as well as corals, seagrass meadows, and sponge gardens. The proposed port would attract massive ships that would pass through a critical resting and nursing ground for one of the world’s largest humpback whale populations, posing serious threats of vessel strike and disturbance. 

Tens of thousands of people have joined AMCS-Protect Ningaloo, the Exmouth-based Cape Conservation Group and many local community members, in opposing the proposal since plans were first announced in 2020.  Over 20,000 emails have been sent to the current and past WA environment ministers calling for them to reject the proposal because it would fundamentally diminish the environmental values of Exmouth Gulf.

AMCS Chief Executive and Protect Ningaloo Director Paul Gamblin said: 

“The Gascoyne Gateway industrial port and dredging proposal is completely incompatible with the environmentally fragile Exmouth Gulf – Ningaloo’s Nursery – and would change this marine wonder forever.  

“An industrial port proposal, jutting nearly a kilometre into Exmouth Gulf and dredging of more than a million cubic metres of the seafloor in one of the world’s most important whale nursing grounds beggars belief.

“Tens of thousands of people have already made clear that industrialisation is unacceptable for Exmouth Gulf. People know that Exmouth Gulf obviously is no place for a port – its future is one of conservation and sustainable, light-touch economic activity, not industrialisation.

“Both the WA and federal governments have signalled that they are committed to protecting Exmouth Gulf so it’s time they made it clear that the future of this natural wonder is economic activity that treads lightly on its fragile environment. They must reject this proposal.

Cape Conservation Group Chair Denise Fitch said: “Exmouth Gulf is where Ningaloo’s whales rest and give birth, where our dugongs and manta rays feed. Dredging a port in the middle of this precious nursery goes against the spirit of stewardship that’s made Ningaloo the conservation and tourism success it has become. 

“Ningaloo is already under pressure from climate change. We’ve recently experienced unprecedented coral bleaching and seagrass damage from marine heatwaves, and further destruction from Cyclone Narelle. Now is not the moment to be adding industrial stressors to this fragile ecosystem. And this is no place for an industrial port. 

“We encourage those who know and love Ningaloo’s nursery to make a submission to the EPA and say no to this unwelcome proposal.”

Protect Ningaloo is calling on Gascoyne Gateway to do the right thing, as two other companies which pursued industrial projects in the Gulf have already done, and withdraw its proposal. 

Overview of Proposed Project

Gascoyne Gateway Ltd proposes to build, own and operate a multipurpose marine complex in Exmouth that will service a variety of vessels including but not limited to cruise liners and associated ecotourism activities, Defence and marine supply vessels. The project will not be utilised for livestock or iron ore.

The Proposal site is located 10 kilometres south of the Exmouth township and immediately south of the Ingram Street light industrial area; opposite the Exmouth landfill site and to the north of the Wilderness Estate residential area.

The proposal has a land-based component (including fuel storage and laydown, supporting marine facilities, desalination plant, renewables precinct, and access and utilities corridor), and a marine component (including marine infrastructure, vessel berths/channels, and anchorages).

An Environmental Review Document (ERD) has been prepared by Gascoyne Gateway Ltd in accordance with Environmental Protection Authority procedures and is released for public review.

The ERD describes the proposal, examines the likely environmental effects and the proposed environmental management procedures associated with the proposed development.

The Proposal includes a land based component (106.54 ha footprint within a 119.02 ha terrestrial development envelope) to support the marine infrastructure (61.63 ha marine footprint within and 79.44 ha marine development envelope) which includes a combination rock groyne and pylon steel construction to a berth-face. The berth face will require 13.5 m of cleared depth (at chart datum, equivalent to depth at LAT) to meet design vessel draughts, achieved by both natural depth and some dredging of sand and seabed limestone at the berth pocket. Marine construction includes piling and dredging, with dredge spoil used in the causeway construction. Three anchorage locations of 1nm diameter each are located in Exmouth Gulf approximately 9.5 km to the north east of the end of the causeway, within a nominal anchorage development envelope of 1153.14 ha. 

The ERD is available for download from Gascoyne Gateway Marine Complex | EPA Western Australia under 3. Assessment > Environmental Review.

The document is also available on the proponent’s website at Gascoyne Gateway Marine Complex.

Submissions should be made here: https://consultation.epa.wa.gov.au/assessment-and-compliance/gascoyne-gateway-marine-complex-per/

Submissions close November 16

Australian Bass and Estuary Perch season commences 1 September

Department of Primary Industries and Regional Development (DPIRD) Program Leader Fish Stocking and Enhancement Operations, Jim Harnwell, said a zero-bag limit is implemented each year in estuaries and rivers below impoundments between 1 June and 31 August. “Australian Bass and Estuary Perch undertake their annual spawning during late autumn and early winter in these waters each year,” Mr Harnwell said.

“The three-month closure plays an important role in protecting these iconic native species, when they form schools and migrate to estuarine areas with the salinity levels needed to trigger spawning.

“The spawning closure doesn’t apply in impoundments or rivers above impoundments, as these species do not breed naturally in these waters.

“From 1 September, fishers can once again take both Australian Bass and Estuary Perch in all waters, however they are reminded that strict bag and size limits remain in place.”

A bag limit of two and a possession limit of four applies to Australian Bass and Estuary Perch, whether for a single species or a combination of both.

Fishers are also reminded that when fishing in rivers, only one fish over 35cm in length may be retained.

Mr Harnwell said spring is one of the best times to take Australian Bass and Estuary Perch, with the fish typically moving further upstream and providing excellent wilderness-style fishing opportunities in smaller creeks and tributaries.

“With the spawning season now complete, conditions are looking promising for both species and we are expecting another great season ahead,” Mr Harnwell said.

“We encourage fishers to get out on the water and enjoy some fantastic fishing for Australian Bass and Estuary Perch this spring and summer”.

NSW DPIRD will continue stocking Australian Bass in impoundments across the State from October, with plans to also stock Estuary Perch into Brogo Dam later this year, to provide a variety of world-class sportfishing opportunities.

Fishers can check the latest rules in the NSW Recreational Fishing Guide, available from DPIRD Fisheries offices, bait and tackle shops, fishing fee agents or online.

Anyone planning on fishing in NSW should ensure they hold a current NSW Recreational Fishing Fee Receipt (unless exempt), which can be purchased online through Service NSW or from a fishing fee agent for as little as $7 for three days.

Suspected illegal fishing can be reported to the Fishers Watch Phoneline on 1800 043 536 or via the online reporting form on the NSW DPIRD Fisheries website.

Estuary Perch - Image credit - NSW DPIRD

Get Ready Weekend 2026

Prepare for Bush Fire Season with Get Ready Weekend 2026

As the bush fire season approaches, now is the time to understand your bush fire risk and take simple steps to prepare your home, property and family. To help you get ready, the NSW Rural Fire Service (RFS) hosts Get Ready Weekend events across the state, providing free information, practical advice and resources to help you prepare before the fire season begins.

Use the map above to find your nearest Get Ready Weekend event or activation. With hundreds of events taking place across NSW, Get Ready Weekend is your opportunity to get practical advice from your local RFS brigade, ask questions about your property's bush fire risk and learn simple actions that could make a real difference this fire season.

Every event is different, but many include demonstrations, displays, family-friendly activities, practical advice from volunteers and resources to help you prepare for the bush fire season. You can also learn how to create a Bush Fire Survival Plan, prepare your home and property, understand the Australian Fire Danger Rating System (AFDRS), and discover the steps you can take to be better prepared.

Get Ready Weekend 2026 will be held across NSW, with most events taking place on 19–20 September.

Get prepared now at myfireplan.com.au

Flying-fox Census 

Do you live near a flying-fox roost? 
Join the next quarterly census to help us learn more about flying-fox population trends.

Flying-foxes travel long distances, so coordinated, cross-border monitoring is key. Your contribution to the National Flying-fox Monitoring Program will ensure governments around Australia, including our Saving our Species program, researchers and communities can make informed decisions to protect this species and their ecosystems.

These beautiful creatures are super important pollination contributors. Loss of habitat and rising temperatures is an issue for them locally.

Become a citizen scientist by learning more at https://bit.ly/NationalFlying-foxMonitoringProgram


Photos in graphic: Shane Ruming, Matthew Mo / DCCEEW

Katandra Bushland Sanctuary Season 2026

Dedicated to the Study & Preservation of Native Flora & Fauna of the warriewood, Mona Vale & Ingleside Area

Website: katandrabushlandsanctuary.com/home

Email: katandrainfo@gmail.com

Katandra is open to visitors 10am to 4pm every Sunday from July to October (inclusive). Group visits can be organised at alternative times. Please visit the Katandra Bushland Sanctuary website for more information.

Katandra Bushland Sanctuary is situated in on the face of the Ingleside escarpment, overlooking the Warriewood Valley and the seaside suburb of Pittwater's Mona Vale. Enter Lane Cove road via the traffic lights to access.

Sydney Spring Garden Competition

The Sydney Spring Garden Competition is one of Australia’s most prestigious and historic awards programs, recognising horticultural excellence and community pride throughout Sydney’s neighbourhoods. Inspired by the 1933 bequest of Lt. Col. Charles Ronald Christian, the competition celebrates outstanding front gardens visible from the road or footpath, with classes open to all types – from apartment balconies and terrace pots to heritage landscapes. 

Entries are judged by panels of horticulturists, landscape designers, retailers, community leaders and educators, offering participants detailed feedback on creativity, design and impact. Open to first-time gardeners and seasoned horticulturalists alike, the competition benchmarks individual achievement and neighbourhood contribution, helping to create more beautiful, cohesive communities across the city.

Entries are now open for the 2026 edition and close September 21, 2026

Enter here: www.rasnsw.com.au/competitions/flower-and-garden/sydney-spring-garden-competition

Stony Range Spring Festival 2026: September 13

PNHA Activities 2026

Our walks for 2026 are listed below. 

You are very welcome to bring friends and older children on these outings. Please book by emailing pnhainfo@gmail.com and include  your PHONE NUMBER so we can contact you in case of changes because of weather etc. 

Looking forward to getting out and about in our lovely area! 

Your PNHA Committee

Pittwater Natural Heritage Association

The Pittwater Natural Heritage Association has been formed to act to protect and preserve the Pittwater areas major and most valuable asset - its natural heritage.

PNHA is an incorporated association seeking broad based community membership and support to enable it to have an effective and authoritative voice speaking out for the preservation of Pittwater's natural heritage.

Our Aims

  • To raise public awareness of the conservation value of the natural heritage of the Pittwater area: its landforms, watercourses, soils and local native vegetation and fauna.
  • To raise public awareness of the threats to the long-term sustainability of Pittwater's natural heritage.
  • To foster individual and community responsibility for caring for this natural heritage.
  • To encourage Pittwater Council and the NSW Government to adopt and implement policies and works which will conserve, sustain and enhance the natural heritage of Pittwater.

Some of our interests and concerns include:

  • Native Tree Canopy
  • "Wildlife Friendly" Gardens
  • Weed Infestation
  • Keeping our Waterways Healthy
  • Beaches and Dunes

Act to Preserve and Protect!

If you would like to join us, please fill out the Membership Form. Visit: https://pnha.org.au

Sunday April 26 Fauna: Underpass below Mona Vale Rd East, Ingleside.

If you missed this walk last year, here’s your chance to see how fauna can move between areas of bushland, so important for finding territory, mates and food. 

Meet 9am at corner of Ingleside Rd and Laurel Rd East. Walk ends about 11am.

Saturday May 23: PNHA stall at Avalon Car Boot Sale, Dunbar Park Avalon.

From 8am to 2pm, we’ll offer Information on identifying and controlling weeds. See our posters about invertebrates in local gardens. Our famous $2 local flora, fauna and scenery cards will be for sale. Come and have a chat. 

Sunday May 24: Walk in Red Hill Bushland Reserve, Beacon Hill

Meet 9am on Lady Penrhyn Drive opposite no. 41A, close to the open gate. Flora, birds, views. Walk ends about 11.30. 

Sunday June 28: Crown to the Sea Walk, Newport

Meet 9am please note that the meeting point is on Burke Rd next to Porter Reserve. Walk ends about 12 noon. This walk goes through several very different bushland reserves with coastal heath and littoral rainforest.

Wildflowers, ferns and coastal views. Moderate fitness needed for some steep tracks and many steps. Limit: 15 people so please book early. We will provide the Crown to the Sea map to participants on booking.

Sunday July 26: Ingleside Chase Reserve

Meet 9am at end of Irrawong Rd North Narrabeen, walk ends about 11am. Birds and swamp forest along Mullet Creek. Swamp Mahoganies will be flowering attracting birds. Binoculars a must for this walk.

Saturday August 22. Spring in the Bush: The Chiltern Track, Ku-ring-gai N.P.

Meet 9am at track entrance with barred gate on Chiltern Rd Ingleside. Walk ends about 11am. One of our favourite walks to see Sydney sandstone flora in spring. Native plant species list available. Birds too, often a Yellow-tufted Honeyeater here. The track is mostly level but very rough in places.

Sunday September 27. Spring in the Bush: Terrey Hills

Meet 9am at corner of Mallawa Rd and Bulara St, Terrey Hills. Walk ends about 11am. With a focus on botany, we’ll see flowering plants in the Proteaceae plant family, waratahs, endangered Grevillea caleyi , and others in the major Australian Proteaceae plant family. You can choose to lengthen this walk which connects to the Perimeter Track. Birds, too.

Sunday October 25: Katandra by Night

Meet 6.45pm at Katandra Bushland Sanctuary on Lane Cove Rd Ingleside. Walk ends about 8.45pm. Sunset is about 7.15. The bush by night is wonderful. We hope to see fireflies again as on previous walks here in October. Bring a torch, or headtorch, preferably with a red light option so as not to dazzle possums. Moderate fitness needed for the bush track and steps. Limit: 15 people, so please book early. 

Sunday November 22: Deep Creek Reserve

Meet 9am in Deep Creek reserve, off Wakehurst Parkway. Walk ends about 11am. Birds and bushland. From the bridge across the creek we may see Dollarbirds, summer breeding migrants that nest in hollows, with their youngsters. Black Bitterns have been observed along the creek margins, so bring binoculars. 

Coming up at Kimbriki

National Parks protect Southern Right Whales with new ‘stay away’ distance of up to 500 metres

The NSW National Parks and Wildlife Service (NPWS) has issued a Special Order for all vessels to stay at least 500 metres, and swimmers 100m, away from all Southern Right Whales in NSW waters.

The Order will be in place until 30 November 2026, when the breeding and calving season ends in NSW.

Southern Right Whales attract a lot of attention as they stay close to beaches and move slowly on the surface. Although incredibly rare, they are easily spotted when they visit.

The Order comes after a mother and calf were recently spotted off Sydney, with curious boaters and locals venturing close to the pair.

The NPWS citizen science project ‘Right Whale ID’ has tracked individual whales through their unique white facial callosities for the past 6 years. Research has found that even a single swimmer approaching too enthusiastically can trigger a significant negative behavioural response in the whale.

Identifying one of the handful or so Southern Right Whales off the NSW Coast each whale season, as opposed to one of the 40,000 humpback whales, is fairly simple.

Any slow-moving, 14-16 metre long whale which is 500m or less off an ocean beach could be a Southern Right Whale.

Identifying features include:

  • a distinctive V-shaped blow when they exhale
  • large broad body size, absence of a dorsal fin
  • white markings (skin growths) on their faces and heads known as ‘callosities’
  • the tail/fluke is geometrically angular and usually black on both top and bottom sides.

Two distinctive colouration patterns. Photo courtesy: Leonardo Lanza 

Southern Right Whale tail fluke. Photo courtesy Michael Cantanzariti

Southern Right Whales have a distinctive V-shaped blow when they exhale

Unlike Humpbacks, mother and calf Southern Right Whales spend more than 90 per cent of their time in waters shallower than 20m, and often less than 500m from shore. While nursing , they move very slowly, engaging in a still, energy-saving behaviour called ‘logging’, which is floating at the surface for long periods.

These behaviours make them highly susceptible to disturbance from overly curious people swimming, paddling or boating too close for the mum’s comfort.

Disturbances can cost the animals precious energy budget as their responses often include significant increases in swim distances as they try to evade them. The disturbance effect is seen in tracking data over subsequent days.

NPWS asks people to comply with the keep-away distances to help protect these mammals.

Members of the public, partner organisations and NPWS staff will collect witness accounts when people venture too close to Southern Right Whales and proceed with investigations where warranted. Non-compliance could result in fines or court appearances.

If anyone spots a Southern Right Whale, please report to NPWS or ORRCA hotlines on 1300 072 757 (13000 PARKS) or (02) 9415 3333 immediately, which allows the Right Whale ID team to get on site as soon as possible.

NSW National Parks and Wildlife Service Marine Wildlife Project Officer Andy Marshall said:

“Doing the right thing by Southern Right Whales means the southeast Australian population has a better chance of recovering.

“I would like to think that future generations will be able to see these incredible animals and be awed by them, in the same way we are today.”

Distances prescribed under the Special Protection Approach Distance Order

Vessels, aircraft, swimmers - Special Protection Approach Distance

  • For vessels including jet skis, surfboards- Stay away 500 metres
  • Operating a crewed aircraft- Stay 610m away – either above or to the side of the whale
  • When swimming including snorkelling and diving- Stay away 100 metres

Mother and calf in Hermanus. Photo courtesy Martin Etsebeth

Solar for apartment residents: Co-funding

Less than 2% of apartment buildings in NSW have solar installed, but the NSW Department of Climate Chnage, Energy, the Environment and Water are on a mission to change this.

Their Solar for Apartment Residents grant is co-funding shared solar panel installations on eligible apartment buildings and multi-unit dwellings and has already helped thousands of households.

They’ve extended the program to help more homeowners and renters reduce their energy bills and have also allocated extra funds through a separate Boost grant to help priority communities too.

Application closes: 4 December 2026, 5:00 pm

Share this with your Owners Corporation or Stata Manager and check your building's eligibility at: www.nsw.gov.au/grants-and-funding/solar-for-apartment-residents-soar-grant-program


Dedicated alpine weather page part of latest BOM website improvements

The Bureau of Meteorology has delivered its latest website update.

In this release navigation has improved, there’s a new dedicated alpine weather page in time for the ski season, and the weather map has more place names.

Bureau of Meteorology CEO Dr Stuart Minchin said the update was a direct response to community feedback.

“Since launch, we've had requests for more locations to be added to the weather map,” Dr Minchin said.

“Our website is there to serve all Australians. We've now added more than 100 place names, primarily in the Northern Territory and Queensland.

“We'll be adding hundreds more in the months ahead.”

The weather map will now remember users’ most recent pan and zoom position, keeping the settings the same for the next time the page is viewed.

For example, if your last visit was a maximum zoomed-in view of Mount Isa, Queensland, this is the view you'll see next time you visit the rain radar.

“Changes like these will make it easier for everyone to find what they need,” Dr Minchin said.

Other changes include the UV Index being restored to the hourly forecast and updating the presentation of flood warnings.

A new alpine weather page provides weather map layers for snow, wind and temperature, and forecasts for snow resorts, towns, and remote areas in Australia's alpine regions in one page.

The updated Alpine regions page provides weather maps and forecasts for snow resorts, towns, and remote areas in Australia's alpine regions.

Alpine regions offers information across 2 tabs:

  • Forecasts – alpine districts and locations
  • Map – 3 hourly snow, wind and temperature forecasts.

Navigating the website has become easier with changes to tabs and page layouts on a number of key pages such as Forecasts and observations, Coasts and Oceans and state, territory and district pages.

“People have told us that navigating to forecasts and observations for districts and states was hard,” Dr Minchin said.

“We’ve paid close attention to this feedback.

“Combined with last month's search improvements, this will make it easier for regional web users to find out if their district is expecting rain or sunshine.”

Updates will continue to be made to the website in response to the feedback received from the community.

Information about recent changes is available at bom.gov.au/website-help/website-updates

The ski season starts on the June long weekend and runs until October's long weekend in NSW. 

The Kiandra Alpine Club's Snow Carnival, 1900. Photo: Kerry

Birdwood Park Bushcare Group Narrabeen

The council has received an application from residents to volunteer to look after bushland at 199/201 Ocean street North Narrabeen.

The group will meet once a month for 2-3 hours at a time to be decided by the group. Activities will consist of weeding out invasive species and encouraging the regeneration of native plants. Support and supervision will be provided by the council.

If you have questions or are interested in joining the group please email the council on bushcare@northernbeaches.nsw.gov.au

Sydney Wildlife (Sydney Metropolitan Wildlife Services) Needs People for the Rescue Line

We are calling on you to help save the rescue line because the current lack of operators is seriously worrying. Look at these faces! They need you! 

Every week we have around 15 shifts either not filled or with just one operator and the busy season is around the corner. This situation impacts on the operators, MOPs, vets and the animals, because the phone line is constantly busy. Already the baby possum season is ramping up with calls for urgent assistance for these vulnerable little ones.

We have an amazing team, but they can’t answer every call in Spring and Summer if they work on their own.  Please jump in and join us – you would be welcomed with open arms!  We offer lots of training and support and you can work from the office in the Lane Cove National Park or on your home computer.

If you are not able to help do you know someone (a friend or family member perhaps) who might be interested?

Please send us a message and we will get in touch. Please send our wonderful office admin Carolyn an email at  sydneywildliferescueline@gmail.com

622kg of Rubbish Collected from Local Beaches: Adopt your local beach program

Sadly, our beaches are not as pristine as we'd all like to think they are. 

Surfrider Foundation Northern Beaches' Adopt A beach ocean conservation program is highlighting that we need to clean up our act.

Surfrider Foundation Northern Beaches' states:
''The collective action by our amazing local community at their monthly beach clean events across 9 beach locations is assisting Surfrider Foundation NB in the compilation of quantitative data on the volume, type and often source of the marine pollution occurring at each location.

In just 6 sessions, clear indicators are already forming on the waste items and areas to target with dedicated litter prevention strategies.

Plastic pollution is an every body problem and the solution to fixing it lies within every one of us.
Together we can choose to refuse this fate on our Northern beaches and turn the tide on pollution. 
A cleaner coast together !''

Join us - 1st Sunday of the month, Adopt your local for a power beach clean or donate to help support our program here. https://www.surfrider.org.au/donate/

Event locations 
  • Avalon – Des Creagh Reserve (North Avalon Beach Lookout)
  • North Narrabeen – Corner Ocean St & Malcolm St (grass reserve next to North Narrabeen SLSC)
  • Collaroy– 1058 Pittwater Rd (beachfront next to The Beach Club Collaroy)
  • Dee Why Beach –  Corner Howard Ave & The Strand (beachfront grass reserve, opposite Blu Restaurant)
  • Curl Curl – Beachfront at North Curl Curl Surf Club. Shuttle bus also available from Harbord Diggers to transport participants to/from North Curl Curl beach. 
  • Freshwater Beach – Moore Rd Beach Reserve (opposite Pilu Restaurant)
  • Manly Beach – 11 South Steyne (grass reserve opposite Manly Grill)
  • Manly Cove – Beach at West Esplanade (opposite Fratelli Fresh)
  • Little Manly– 55 Stuart St Little Manly (Beachfront Grass Reserve)
… and more to follow!

Surfrider Foundation Northern Beaches

This Tick Season: Freeze it - don't squeeze it

Notice of 1080 Poison Baiting

The NSW National Parks and Wildlife Service (NPWS) will be conducting a baiting program using manufactured baits, fresh baits and Canid Pest Ejectors (CPE’s/ejectors) containing 1080 poison (sodium fluoroacetate) for the control of foxes. The program is continuous and ongoing for the protection of threatened species.

This notification is for the period to 31 July 2026 at the following locations:

  • Garigal National Park
  • Lane Cove National Park (baits only, no ejectors are used in Lane Cove National Park)
  • Ku-ring-gai Chase National Park
  • Sydney Harbour National Park – North Head (including the Quarantine Station), Dobroyd Head, Chowder Head & Bradleys Head managed by the NPWS
  • The North Head Sanctuary managed by the Sydney Harbour Federation Trust
  • The Australian Institute of Police Management, North Head

DO NOT TOUCH BAITS OR EJECTORS

All baiting locations will be identifiable by signs.

Please be reminded that domestic pets are not permitted on NPWS Estate. Pets and working dogs may be affected (1080 is lethal to cats and dogs). Pets and working dogs must be restrained or muzzled in the vicinity and must not enter the baiting location. Penalties apply for non-compliance.

In the event of accidental poisoning seek immediate veterinary assistance.

For further information please call the local NPWS office on:

NPWS Sydney North (Middle Head) Area office: 9960 6266

NPWS Sydney North (Forestville) Area office: 9451 3479

NPWS North West Sydney (Lane Cove NP) Area office: 8448 0400

NPWS after-hours Duty officer service: 1300 056 294

Sydney Harbour Federation Trust: 8969 2128

Volunteers for Barrenjoey Lighthouse Tours needed

Details:

Johnson Brothers Mitre 10 Recycling Batteries: at Mona Vale + Avalon Beach

Over 18,600 tonnes of batteries are discarded to landfill in Australia each year, even though 95% of a battery can be recycled!

That’s why we are rolling out battery recycling units across our stores! Our battery recycling units accept household, button cell, laptop, and power tool batteries as well as mobile phones! 

How To Dispose Of Your Batteries Safely: 

  1. Collect Your Used Batteries: Gather all used batteries from your home. Our battery recycling units accept batteries from a wide range of products such as household, button cell, laptop, and power tool batteries.
  2. Tape Your Terminals: Tape the terminals of used batteries with clear sticky tape.
  3. Drop Them Off: Come and visit your nearest participating store to recycle your batteries for free (at Johnson Brothers Mitre 10 Mona Vale and Avalon Beach).
  4. Feel Good About Your Impact: By recycling your batteries, you're helping support a healthier planet by keeping hazardous material out of landfills and conserving resources.

Environmental Benefits

  • Reduces hazardous waste in landfill
  • Conserves natural resources by promoting the use of recycled materials
  • Keep toxic materials out of waterways 

Reporting Dogs Offleash - Dog Attacks to Council

If the attack happened outside local council hours, you may call your local police station. Police officers are also authorised officers under the Companion Animals Act 1998. Authorised officers have a wide range of powers to deal with owners of attacking dogs, including seizing dogs that have attacked.

You can report dog attacks, along with dogs offleash where they should not be, to the NBC anonymously and via your own name, to get a response, at: https://help.northernbeaches.nsw.gov.au/s/submit-request?topic=Pets_Animals

If the matter is urgent or dangerous call Council on 1300 434 434 (24 hours a day, 7 days a week).

If you find injured wildlife please contact:
  • Sydney Wildlife Rescue (24/7): 9413 4300 
  • WIRES: 1300 094 737

Plastic Bread Ties For Wheelchairs

The Berry Collective at 1691 Pittwater Rd, Mona Vale collects them for Oz Bread Tags for Wheelchairs, who recycle the plastic.

Berry Collective is the practice on the left side of the road as you head north, a few blocks before Mona Vale shops . They have parking. Enter the foyer and there's a small bin on a table where you drop your bread ties - very easy.

A full list of Aussie bread tags for wheelchairs is available at: HERE 


Stay Safe From Mosquitoes 

NSW Health is reminding people to protect themselves from mosquitoes when they are out and about.

NSW Health states Mosquitoes in NSW can carry viruses such as Japanese encephalitis (JE), Murray Valley encephalitis (MVE), Kunjin, Ross River and Barmah Forest. The viruses may cause serious diseases with symptoms ranging from tiredness, rash, headache and sore and swollen joints to rare but severe symptoms of seizures and loss of consciousness.

A free vaccine to protect against JE infection is available to those at highest risk in NSW and people can check their eligibility at NSW Health.

People are encouraged to take actions to prevent mosquito bites and reduce the risk of acquiring a mosquito-borne virus by:
  • Applying repellent to exposed skin. Use repellents that contain DEET, picaridin, or oil of lemon eucalyptus. Check the label for reapplication times.
  • Re-applying repellent regularly, particularly after swimming. Be sure to apply sunscreen first and then apply repellent.
  • Wearing light, loose-fitting long-sleeve shirts, long pants and covered footwear and socks.
  • Avoiding going outdoors during peak mosquito times, especially at dawn and dusk.
  • Using insecticide sprays, vapour dispensing units and mosquito coils to repel mosquitoes (mosquito coils should only be used outdoors in well-ventilated areas)
  • Covering windows and doors with insect screens and checking there are no gaps.
  • Removing items that may collect water such as old tyres and empty pots from around your home to reduce the places where mosquitoes can breed.
  • Using repellents that are safe for children. Most skin repellents are safe for use on children aged three months and older. Always check the label for instructions. Protecting infants aged less than three months by using an infant carrier draped with mosquito netting, secured along the edges.
  • While camping, use a tent that has fly screens to prevent mosquitoes entering or sleep under a mosquito net.
Remember, Spray Up – Cover Up – Screen Up to protect from mosquito bite. For more information go to NSW Health.

Mountain Bike Incidents On Public Land: Survey

This survey aims to document mountain bike related incidents on public land, available at: https://www.surveymonkey.com/r/K88PSNP

Sent in by Pittwater resident Academic for future report- study. 

Report fox sightings

Fox sightings, signs of fox activity, den locations and attacks on native or domestic animals can be reported into FoxScan. FoxScan is a free resource for residents, community groups, local Councils, and other land managers to record and report fox sightings and control activities. 

Our Council's Invasive species Team receives an alert when an entry is made into FoxScan.  The information in FoxScan will assist with planning fox control activities and to notify the community when and where foxes are active.


marine wildlife rescue group on the Central Coast

A new wildlife group was launched on the Central Coast on Saturday, December 10, 2022.

Marine Wildlife Rescue Central Coast (MWRCC) had its official launch at The Entrance Boat Shed at 10am.

The group comprises current and former members of ASTR, ORRCA, Sea Shepherd, Greenpeace, WIRES and Wildlife ARC, as well as vets, academics, and people from all walks of life.

Well known marine wildlife advocate and activist Cathy Gilmore is spearheading the organisation.

“We believe that it is time the Central Coast looked after its own marine wildlife, and not be under the control or directed by groups that aren’t based locally,” Gilmore said.

“We have the local knowledge and are set up to respond and help injured animals more quickly.

“This also means that donations and money fundraised will go directly into helping our local marine creatures, and not get tied up elsewhere in the state.”

The organisation plans to have rehabilitation facilities and rescue kits placed in strategic locations around the region.

MWRCC will also be in touch with Indigenous groups to learn the traditional importance of the local marine environment and its inhabitants.

“We want to work with these groups and share knowledge between us,” Gilmore said.

“This is an opportunity to help save and protect our local marine wildlife, so if you have passion and commitment, then you are more than welcome to join us.”

Marine Wildlife Rescue Central Coast has a Facebook page where you may contact members. Visit: https://www.facebook.com/profile.php?id=100076317431064


Watch out - shorebirds about

Pittwater is home to many resident and annually visiting birds. If you watch your step you won't harm any beach-nesting and estuary-nesting birds have started setting up home on our shores.

Did you know that Careel Bay and other spots throughout our area are part of the East Asian-Australasian Flyway Partnership (EAAFP)?

This flyway, and all of the stopping points along its way, are vital to ensure the survival of these Spring and Summer visitors. This is where they rest and feed on their journeys.  For example, did you know that the bar-tailed godwit flies for 239 hours for 8,108 miles from Alaska to Australia?

Not only that, Shorebirds such as endangered oystercatchers and little terns lay their eggs in shallow scraped-out nests in the sand, NSW National Parks and Wildlife Service (NPWS) Threatened Species officer Ms Katherine Howard has said.
Even our regular residents such as seagulls are currently nesting to bear young.

What can you do to help them?
Known nest sites may be indicated by fencing or signs. The whole community can help protect shorebirds by keeping out of nesting areas marked by signs or fences and only taking your dog to designated dog offleash area. 

Just remember WE are visitors to these areas. These birds LIVE there. This is their home.

Four simple steps to help keep beach-nesting birds safe:
1. Look out for bird nesting signs or fenced-off nesting areas on the beach, stay well clear of these areas and give the parent birds plenty of space.
2. Walk your dogs in designated dog-friendly areas only and always keep them on a leash over summer.
3. Stay out of nesting areas and follow all local rules.
4. Chicks are mobile and don't necessarily stay within fenced nesting areas. When you're near a nesting area, stick to the wet sand to avoid accidentally stepping on a chick.


Possums In Your Roof?: do the right thing

Possums in your roof? Please do the right thing 
On the weekend, one of our volunteers noticed a driver pull up, get out of their vehicle, open the boot, remove a trap and attempt to dump a possum on a bush track. Fortunately, our member intervened and saved the beautiful female brushtail and the baby in her pouch from certain death. 

It is illegal to relocate a trapped possum more than 150 metres from the point of capture and substantial penalties apply.  Urbanised possums are highly territorial and do not fare well in unfamiliar bushland. In fact, they may starve to death or be taken by predators.

While Sydney Wildlife Rescue does not provide a service to remove possums from your roof, we do offer this advice:

✅ Call us on (02) 9413 4300 and we will refer you to a reliable and trusted licenced contractor in the Sydney metropolitan area. For a small fee they will remove the possum, seal the entry to your roof and provide a suitable home for the possum - a box for a brushtail or drey for a ringtail.
✅ Do-it-yourself by following this advice from the Department of Planning and Environment: 

❌ Do not under any circumstances relocate a possum more than 150 metres from the capture site.
Thank you for caring and doing the right thing.


Sydney Wildlife photos

Aviaries + Possum Release Sites Needed

Pittwater Online News has interviewed Lynette Millett OAM (WIRES Northern Beaches Branch) needs more bird cages of all sizes for keeping the current huge amount of baby wildlife in care safe or 'homed' while they are healed/allowed to grow bigger to the point where they may be released back into their own home. 

If you have an aviary or large bird cage you are getting rid of or don't need anymore, please email via the link provided above. There is also a pressing need for release sites for brushtail possums - a species that is very territorial and where release into a site already lived in by one possum can result in serious problems and injury. 

If you have a decent backyard and can help out, Lyn and husband Dave can supply you with a simple drey for a nest and food for their first weeks of adjustment.

Mona Vale Dunes bushcare group: 2026 Dates

What’s Happening? Mona Vale Dunes Bushcare group catch-up. 

In 2026 our usual work mornings will be the second Saturday and third Thursday of each month. You can come to either or both. 

We are maintaining an area south of Golf Avenue. This was cleared of dense lantana, green cestrum and ground Asparagus in 2019-2020. 600 tubestock were planted in June 2021, and natural regeneration is ongoing. 

Photos: The site In November 2019, chainsaws at the ready. In July 2025, look at the difference - coastal dune vegetation instead of dense weeds. But maintenance continues and bushcarers are on the job. Can you join us?

(access to this southern of MV Dunes  - parking near Mona Vale Headland reserve, or walk from Golf Ave.) 

For comparison, see this image of MV dunes in 1969!, taken from atop the home units at the end of Golf Avenue. 

2026 Dates

Bangalley Headland WPA Bushcare 2026

Watch out for PNHA signs telling you about bush regeneration and our local environment. This is one of many coming up.

Bushcare in Pittwater: where + when

For further information or to confirm the meeting details for below groups, please contact Council's Bushcare Officer on 9970 1367 or visit Council's bushcare webpage to find out how you can get involved.

BUSHCARE SCHEDULES 
Where we work                      Which day                              What time 

Avalon     
Angophora Reserve             3rd Sunday                         8:30 - 11:30am 
Avalon Dunes                        1st Sunday                         8:30 - 11:30am 
Avalon Golf Course              2nd Wednesday                 3 - 5:30pm 
Careel Creek                         4th Saturday                      8:30 - 11:30am 
Toongari Reserve                 3rd Saturday                      9 - 12noon (8 - 11am in summer) 
Bangalley Headland            2nd Sunday                         9 to 12noon 
Catalpa Reserve              4th Sunday of the month        8.30 – 11.30
Palmgrove Park              1st Saturday of the month        9.00 – 12 

Bayview     
Winnererremy Bay                 4th Sunday                        9 to 12noon 

Bilgola     
North Bilgola Beach              3rd Monday                        9 - 12noon 
Algona Reserve                     1st Saturday                       9 - 12noon 
Plateau Park                          1st Friday                            8:30 - 11:30am 

Church Point     
Browns Bay Reserve             1st Tuesday                        9 - 12noon 
McCarrs Creek Reserve       Contact Bushcare Officer     To be confirmed 

Clareville     
Old Wharf Reserve                 3rd Saturday                      8 - 11am 

Elanora     
Kundibah Reserve                   4th Sunday                       8:30 - 11:30am 

Mona Vale     
Mona Vale Beach Basin          1st Saturday                    8 - 11am 
Mona Vale Dunes                     2nd Saturday +3rd Thursday     8:30 - 11:30am 

Newport     
Bungan Beach                          4th Sunday                      9 - 12noon 
Crescent Reserve                    3rd Sunday                      9 - 12noon 
North Newport Beach              4th Saturday                    8:30 - 11:30am 
Porter Reserve                          2nd Saturday                  8 - 11am 

North Narrabeen     
Irrawong Reserve                     2nd Saturday                   2 - 5pm 

Palm Beach     
North Palm Beach Dunes      3rd Saturday                    9 - 12noon 

Scotland Island     
Catherine Park                          2nd Sunday                     10 - 12:30pm 
Elizabeth Park                           1st Saturday                      9 - 12noon 
Pathilda Reserve                      3rd Saturday                      9 - 12noon 

Warriewood     
Warriewood Wetlands             1st Sunday                         8:30 - 11:30am 

Whale Beach     
Norma Park                               1st Friday                            9 - 12noon 

Western Foreshores     
Coopers Point, Elvina Bay      2nd Sunday                        10 - 1pm 
Rocky Point, Elvina Bay           1st Monday                          9 - 12noon

Friends Of Narrabeen Lagoon Catchment Activities

Bush Regeneration - Narrabeen Lagoon Catchment  
This is a wonderful way to become connected to nature and contribute to the health of the environment.  Over the weeks and months you can see positive changes as you give native species a better chance to thrive.  Wildlife appreciate the improvement in their habitat.

Belrose area - Thursday mornings 
Belrose area - Weekend mornings by arrangement
Contact: Phone or text Conny Harris on 0432 643 295

Wheeler Creek - Wednesday mornings 9-11am
Contact: Phone or text Judith Bennett on 0402 974 105
Or email: Friends of Narrabeen Lagoon Catchment : email@narrabeenlagoon.org.au

Gardens and Environment Groups and Organisations in Pittwater


Ringtail Posses 2023

A landmark UN report says the world will overshoot the 1.5°C climate target. What happens now?

dry reservoir and small stream entering it, aerial view
Christopher Furlong/Getty
Jacqueline Peel, The University of Melbourne and Wesley Morgan, UNSW

For over a decade, the world has been trying to limit global warming to 1.5°C.

That’s no longer possible, according to a new United Nations report. We will likely pass 1.5°C in 2030. That’s not good news for anyone, least of all Australia’s Pacific Island neighbours who face rapidly rising seas.

In response to the report, Palau’s President Surangel Whipps Jr said:

It is hard to overstate the depth of emotion for those of us living on the frontline after having fought so hard to put the 1.5 degree limit at the heart of the Paris Agreement […] calls for greater ambition are no longer enough — we need to see an urgent and unprecedented increase in political will and investment in a climate safe future

The small silver lining is that it’s still possible for this to be a temporary overshoot of the target. If nations redouble their efforts to phase out fossil fuels and reduce other sources of emissions, they could limit peak warming to 1.8°C and then use carbon removal methods to bring temperatures back to 1.5°C or below this century.

In 2026, the world is already about 1.4°C warmer than pre-industrial levels, and the damage and death toll from climate-boosted disasters is ramping up. The United Kingdom is warning of possible food shortages amid a historic drought. Wildfires hit new areas in France and Spain, while glaciers are melting rapidly and the oceans are at their hottest level on record. The enormous El Niño event emerging in the Pacific is likely to bring major disruption. Every fraction of a degree makes things worse.

There are no good outcomes if we remain above 1.5°C. Urgent cuts to emissions and efforts to protect the most vulnerable are our best remaining options. Failure to do so risks irreversible harm.

sandbars and low river level, empty boat in foreground.
Major European rivers are at record low levels this year, threatening trade, power plants and farming. Pictured: the Danube River in southeastern Romania on August 5. Xinhua News Agency/Getty

Why does 1.5°C matter so much?

The 2015 Paris Agreement established a shared goal for the world: keep the rise in global average temperatures above pre-industrial levels “well below” 2°C and “pursue efforts” to hold warming to 1.5°C.

This goal was set based on expert scientific assessments that warming of more than 2°C would be dangerous and that limiting warming to 1.5°C was necessary to minimise climate risks.

Pacific nations fought hard to include 1.5°C in the agreement, arguing it was essential for their communities to “stay alive” in the face of rising sea levels and other climate-fuelled threats.

Last year, the world’s top court – the International Court of Justice – ruled that 1.5°C is the primary temperature limit nations have committed to work towards.

This ruling means that if governments fail to act as ambitiously as they can, they could be sued in international courts.

In May this year, a majority of nations voted in the UN General Assembly to endorse the court’s ruling and urge action to keep to 1.5°C.

It’s not time to give up

Warming of 1.5°C will be bad. But 1.6°C will be worse, and 1.7°C worse again. Every increase will bring more extreme weather, more loss of nature, more loss of land to the sea and more harm to humans.

If we stay over 1.5°C, we risk triggering climate tipping points – sudden shifts which cannot be undone on human timescales. These include the Greenland and West Antarctic ice sheets melting, the collapse of crucial heat-distributing currents in the Atlantic Ocean or the Amazon rainforest becoming a source of emissions.

Overshooting 1.5°C doesn’t mean it’s time to throw out the Paris Agreement. It’s not working fast enough, but it is working.

Solar power and electric vehicles have boomed and electrification has accelerated. Nations have cut emissions enough to avoid the worst climate futures of a 3°C rise or even higher. According to the Climate Action Tracker, the Paris Agreement has averted the equivalent of 1°C of warming. Rather than hitting 3.6°C by 2100, the world is on track for 2.6°C.

While this is progress, it is not enough. Global emissions are plateauing, but have still not begun to fall in earnest.

As damage from climate change mounts, leaders must do the work and begin rapidly cutting emissions to keep the goal of net-zero by 2050 alive.

To get temperatures back under 1.5°C, we will also need to pull gigatonnes of carbon dioxide back out of the atmosphere using tree planting and nature restoration. We may also need technological approaches such as rock weathering or ocean alkalinity enhancement, though these are not proven at scale and can come with other risks.

wind turbine and coal plant seen at a distance, grey sky.
There has been progress on climate change since 2015 – but not enough. acilo/Getty

We are all in this together

It may seem as if climate action faces impossible headwinds, as populism surges and the current United States administration doubles down on fossil fuels.

It’s worth looking beyond these headlines. It took almost 70 years for the world to install a terawatt of solar power, but then just two years for the second and another two for the third terawatt. In ten years, that figure will likely have tripled. Developing nations are moving rapidly to take up non-polluting electric transport.

Climate change can no longer be ignored. As damage mounts, nations will have to cooperate to cut emissions as rapidly as possible and figure out how to safely and equitably pull carbon back out of the atmosphere. Action depends on strong political will, inclusive governance, and finance to help developing countries cut emissions and adapt.

In November, Australia will lead negotiations at the next international climate summit, COP31, in Turkey. Leaders and diplomats will work to keep 1.5°C in reach – even after overshoot. Australia can point to its own rapid clean energy transition and urge others to set clear pathways to go electric – and wean themselves off the production and use of fossil fuels.

Climate change has been described as a super wicked problem – big, complex and impossible to solve simply. The solution is to see the urgency of the issue and act cooperatively to tackle it. If we make it a problem for the next generation, there may be no way back to a safe climate.The Conversation

Jacqueline Peel, Professor of Law, The University of Melbourne and Wesley Morgan, Research Associate, Institute for Climate Risk and Response, UNSW

This article is republished from The Conversation under a Creative Commons license. Read the original article.

Some of Australia’s biggest companies are planning for an unbearable climate future

An aerial photo of the red Australian desert.
Andrew Merry/Getty
Jacqueline Peel, The University of Melbourne; Nina Araneta-Alana, The University of Melbourne, and Suzanne Varrall, The University of Melbourne

Even as unprecedented fires and heatwaves rage across Europe, scientists track the retreat of Antarctic sea ice and a supercharged El Niño system heads our way, Australia’s largest companies are forecasting business-as-usual in a much hotter world.

Last year, Australia introduced mandatory company climate reporting. They must now disclose the climate “risks and opportunities” that may affect their prospects.

Several of Australia’s biggest energy and resource companies have now published new sustainability reports as part of annual financial reporting.

Their disclosures reveal the climate future they are planning for, and whether this is aligned with international science-based targets such as the Paris Agreement’s 1.5°C warming threshold.

What we’re seeing is alarming.

Companies planning for an unbearable future

Most of these reports indicate big companies are developing strategies on a climate change “base case” – a representation of what they consider most likely to happen – of more than 2°C of warming. The future temperature rise they’re planning for is one scientists say would deliver an unbearably hot planet.

Some of Australia’s largest miners have followed this approach. Both Rio Tinto and BHP expect global temperature increases of more than 2°C by the end of the century.

Not every company reveals the increase in global temperature they are planning for. But even if they don’t, their disclosures show they’re not expecting temperatures to hold to 1.5°C.

Energy companies AGL and Origin Energy both express confidence their strategies and business models will remain robust, even if temperatures accelerate beyond 2.6°C warming. This increase would put the Australian economy, environment and community at severe risk.

Mining machinery suspended above a red pile of iron ore.
The assumption that business-as-usual will be possible in a hotter world is out of step with the latest science. Cuhrig/Getty

Companies hold power

Companies often argue that governments are responsible for creating policy to address global warming. But this underestimates the power corporate leaders hold to shape Australia’s shared climate future through financial decisions.

For example, mining giant BHP expects demand for steelmaking coal to remain robust for decades, with customers from China, India and Southeast Asia. This underpins the valuation of its major export commodities, and appears to justify the lack of plans to scale down steelmaking coal production. However, this assumption sits uneasily with the fact these same countries have their own net-zero targets.

Similarly, Rio Tinto confirms “no portfolio adjustments” are made to its future production plans. Its central case estimate of 2.1–2.3°C of warming by 2100 assumes developing countries will miss or delay their stated net-zero targets, underwriting business-as-usual production for the company.

Disclosures out of step with science

However, the assumption that business-as-usual will be possible in a hotter world is out of step with the latest science. The Paris Agreement’s temperature goal was set in 2015 based on exhaustive scientific assessments that warming of more than 2°C would be dangerous, and limiting warming to 1.5°C was necessary to minimise climate risks.

Scientific knowledge about how much global warming is “safe” has exponentially increased. It reemphasises the need to keep to 1.5°C with “limited overshoot”. This means we can only exceed 1.5°C temporarily, and simultaneously need to be working to bring temperatures back down. Only then will we minimise irreversible changes such as sea level rise, the disappearance of coral reefs or vast sea ice loss at the poles.

Scientific best estimates find we can’t go over 1.5°C by more than 0.1–0.3°C (a “peak temperature” of 1.6–1.8°C) and still return warming to safe levels. Even then, the longer we stay above 1.5°C and the extent to which we exceed this threshold, the more devastating the outcome.

Is this legal?

Legally, there’s no issue with companies using a base case for planning that exceeds 2°C of warming. But this approach isn’t in line with Australia’s broader international legal obligations. Companies will likely face increased investor scrutiny or reputational blowback when they walk back climate commitments.

In July 2025, the world’s highest court, the International Court of Justice (ICJ), confirmed 1.5°C is the temperature limit countries are aiming for. To meet their Paris Agreement promises, governments — including Australia — have to show the most ambitious action the country can realistically take to help keep warming under 1.5°C. Australia’s latest plan for a 62–70% emissions cut from 2005 levels was submitted in September 2025.

The court confirmed the Paris Agreement also requires governments to take action at home to cut emissions in line with the 1.5°C goal — including introducing rules for businesses operating in their countries. To follow international law, the Australian government needs to use every tool available to regulate the emissions of big companies, based on the best available science. Countries that don’t comply could be sued before the ICJ and ordered to pay compensation to other nations.

What about Australia’s climate policy?

Big companies in Australia contribute more than 30% of our domestic emissions. If we also include emissions from the fossil fuels some of these companies produce, it raises Australia’s global carbon footprint to around 4.5% of global fossil carbon dioxide emissions, second only to Russia. Making sure big companies do their bit to reduce emissions is essential for Australia to meet its climate targets.

This year, Australia is the “President of Negotiations” for COP31. This is an opportunity for Australia to show it’s doing all it can – internationally and in its own backyard – to support compliance with the Paris Agreement and accelerate climate action. From their new disclosures, it doesn’t seem that Australia’s biggest companies have got the memo.The Conversation

Jacqueline Peel, Professor of Law, The University of Melbourne; Nina Araneta-Alana, Research fellow, Laureate Program on Global Corporate Climate Accountability, The University of Melbourne, and Suzanne Varrall, Research Fellow, Laureate Program on Global Corporate Climate Accountability, The University of Melbourne

This article is republished from The Conversation under a Creative Commons license. Read the original article.

Sea‑level rise, fuel shortages and missile tests top the agenda as Albanese heads to Palau for Pacific talks

A low-lying Pacific island in Tuvalu surrounded by blue sea.
Ashley Cooper/Getty
Wesley Morgan, UNSW

Prime Minister Anthony Albanese is in Palau’s capital Koror this week for the annual Pacific Islands Forum, and regional security is expected to top the agenda.

China is testing nuclear-capable missiles in the Pacific, prompting talk of a new regional agreement. The United States-Iran war has exposed a reliance on costly fossil fuels that is undermining Pacific economies.

And as the world comes perilously close to the Paris Agreement’s 1.5°C temperature goal, a record-breaking El Nino looms in the Pacific Ocean.

But the forum will be missing key leaders – Solomon Islands Prime Minister Matthew Wale made a shock departure, flying out of Palau just hours after arriving, in order to deal with a looming leadership challenge back home.

And Kiribati President Taneti Maamau, Samoan Prime Minister Laʻauli Leuatea Schmidt, and Vanuatu’s prime minister, Jotham Napat, are also not attending. It is unclear if Fiji’s prime minister, Sitiveni Rabuka, will be present.

Pacific nations will want Albanese to address the world’s key security threat – climate change. As co-president of the COP31 climate talks in November, Australia can work with the Pacific to keep 1.5°C within reach, and secure much-needed finance for island nations at the climate frontline.

China’s missile test

Since the second world war, the United States has maintained fortified bases in the Pacific and an unrivalled deep-water navy (the US also regularly tests long-range missiles in the region). However, China’s investment in military capabilities has challenged the status quo.

In July, China launched a nuclear-capable test missile that flew over multiple Pacific nations and hit waters close to Tuvalu’s Exclusive Economic Zone.

This sparked calls for a new regional security agreement: Solomon Islands Prime Minister Matthew Wale said China’s missile test was “not the act of a friend”.

Ironically, it was Solomons Islands that signed a security deal with China in 2022. This changed the security dynamics of a region long aligned with the US and Australia (notwithstanding concerns about nuclear testing and decolonisation).

Since then, Canberra has pursued a web of bilateral deals to shore up Australia’s place as Pacific security partner – first with Tuvalu (2023), then Naoero (formerly Nauru) (2024), Papua New Guinea (2025) and Vanuatu (2026). Discussions are ongoing with Tonga and Solomon Islands. The most recent agreement, an “Ocean of Peace Alliance” signed with Fiji in July, is a mutual defence pact that is open to other Pacific nations to join.

Canberra was already pursuing a treaty allowing for coordinated regional responses to disasters and other crises. China’s missile test may have opened the door for something more.

A close up headshot of Palau president Surangel Whipps Jr in a dark suit with a white collar.
Palau president Surangel Whipps Jr wants the Pacific to become the first region of the world 100% powered by renewables. David Gray/Getty

Renewables the solution to fuel crisis

The Middle East conflict has pushed the Pacific toward an energy crisis. Around 80% of the region’s energy relies on imported oil products, much of which would normally transit the Strait of Hormuz. Even before the US-Iran war, Pacific island countries spent an eye watering percentage of GDP (between 10-25% buying fossil fuels to run power plants, generators, boats and vehicles. This compares to a regional average of 8% spent on education and 6% on health.

The Middle East conflict has only added to the bill. According to a new report, Fiji’s annual refined fuel import costs could rise by US$375 million (A$520 million) if high oil prices persist. This is more than Fiji’s entire healthcare budget.

Renewable energy offers a clear solution. Replacing diesel generators with grid-scale solar and battery storage could save Pacific countries around US$700 million (A$520 million) each year in avoided fuel costs.

The incoming chair of the Pacific Islands Forum, Palau president Surangel Whipps Jr, wants the region to become the first in the world 100% powered by renewables. He says investment of US$120 million (A$ 166 million) is needed for Palau to add 60MW of solar and battery storage, which would enable 90% of its power needs to be met by renewables.

Climate change remains greatest Pacific threat

When climate change was first debated at the UN Security Council in 2007, Pacific countries argued the impacts of a warming planet were “no less serious than those faced by nations and peoples threatened by guns and bombs”.

Since then, Pacific Islands Forum leaders have explicitly reaffirmed climate change is “the single greatest threat” to Pacific security.

In 2025, Earth was 1.44°C warmer than the long-term average. Pacific countries are reeling from stronger cyclones, dying reefs and ocean acidification. Without urgent action to shift away from coal, oil and gas impacts will get much worse. Just this week, the world’s oceans are the warmest on record, fueled by climate change and a rapidly intensifying El Niño event.

It is now almost certain the world will warm past 1.5°C. Yet it remains possible, following a temporary “overshoot”, that countries can limit warming to 1.5°C by the end of the century. This will require deep and immediate emissions reductions and some carbon dioxide removal to achieve “net-negative” emissions.

Limiting global warming to 1.5°C is a line in the sand for low-lying Pacific nations – “1.5 to stay alive” is the slogan. Pacific negotiators helped secure this temperature goal in the 2015 Paris Agreement.

Pacific nations expect Australia, as co-president of COP31 climate talks in November, to reaffirm global commitment to 1.5°C. Australia is helping Fiji and Tuvalu host a pre-COP summit in October that will remind world leaders the survival of island nations is at stake.

Pacific countries will also seek new finance for a Pacific-owned climate fund to invest in community-scale adaptation projects.

Some argue collaboration with the Pacific in the lead-up to COP31 is an expensive exercise. But climate action is crucial to Australian strategy in the region. Investing in renewables and adaptation in the Pacific is an investment in shared security, even as geopolitical competition sharpens between China and the United States.The Conversation

Wesley Morgan, Research Associate, Institute for Climate Risk and Response, UNSW

This article is republished from The Conversation under a Creative Commons license. Read the original article.

The fight over AI data centres is becoming Australia’s next Indigenous policy challenge

A person in high vis standing among desert grass in Western Australia.
Oleh_Slobodeniuk/Getty Images
Jenna Imad Harb, Australian National University and Shanine Ryan, Indigenous Knowledge

In July 2026, more than 200 community members gathered at Mandoon Bilya (Helena River) in Perth’s eastern suburbs. They planted more than 3,000 native flora as part of a wetland restoration project. The hopeful scene was a stark contrast to what the river might have become.

Until recently, Mandoon Bilya was the proposed site of a hyperscale artificial intelligence (AI) data centre. It was scheduled to be one of Australia’s biggest. Aboriginal groups, environmental activists and local community groups successfully opposed the development.

Instead of a 120-megawatt AI facility, the area is now focused on ecological restoration and protecting Country. Community groups are working to realise new visions of the river’s future.

Yet the Mandoon Bilya opposition is about more than one defeated development proposal. As AI drives demand for new facilities, data centres are expected to proliferate across Australia.

The campaign highlights an urgent policy challenge. Policymakers have focused on regulating AI technologies. Yet Aboriginal communities have had little say in AI infrastructure planning.

This includes participating in decisions about the resources and infrastructure on which AI technologies depend. Decisions made now could shape Indigenous relations with the government around AI for years to come.

The case of Mandoon Bilya

Restoration work at Mandoon Bilya follows a hard-fought campaign. It was led by the Bibbul Ngarma Aboriginal Association and supported by environmental and community groups.

Developers planned the project on land containing Aboriginal heritage sites. Opponents argued the proposed data centre threatened a river system with cultural connections for local Aboriginal groups. The river also supports Perth’s drinking water and local ecosystems during warmer months.

All this raised concerns about adequate free, prior and informed consent and impacts on Country.

In May 2026, the proposal was cancelled before being considered by Western Australia’s Development Assessment Panel. Campaigners widely praised the decision. They have since shifted their focus towards broader ecological restoration plans.

The need for Indigenous leadership

Mandoon Bilya isn’t an isolated case; similar debates are emerging elsewhere in Australia. In Victoria, opposition to a proposed AI Hub has raised concerns about cultural heritage and environmental impacts.

AI is often talked about as something virtual. Yet it depends heavily on physical resources: land, water and energy. Data centres use large amounts of all three, creating environmental pressures familiar to many Aboriginal communities.

Internationally, on Turtle Island (what some local First Nations peoples call North America), Indigenous communities are also challenging proposed data centres. They argue such infrastructures compromise Indigenous rights, culturally significant sites and water systems. Such challenges underscore principles echoed in the United Nations Declaration on the Rights of Indigenous Peoples.

More people now recognise the importance of Indigenous leadership in data and digital technologies. We see this, for example, in commitments to Indigenous data sovereignty. This means Indigenous people get to own and control access to their data.

Indigenous leadership should also be central to decisions about the physical systems that make AI possible.

Towards working together

Some projects have begun to incorporate Indigenous participation and ownership. Western Australia’s largest data centre is pursued through an Indigenous Land Use Agreement with the Karajarri People. They are also co-owners of the project.

In the Northern Territory, Energy North has stated it is engaging with Traditional Owners. This consultation is part of the assessment process for its proposed hyperscale data centre.

Yet such examples remain the exception. While Australia is regulating AI infrastructure, few policies require Aboriginal leadership in decision-making.

Kaley Nicholson, chief executive of the Federation of Victorian Traditional Owner Corporations, confirms this. She argues current government expectations for data centres represent “an investment failure”. Such efforts don’t reference collaboration with Traditional Owner groups, despite lasting impacts on Country.

This raises an ongoing and crucial question. Who gets to decide about digital systems that directly impact Indigenous lands, rights and livelihoods?

Peaceful landscape of a brown river surrounded by native trees.
A view of Mandoon Bilya (Helena River) in Western Australia. Michael Griffin/Flickr, CC BY-NC-ND

Not just AI

Conflicts over AI infrastructure echo longstanding debates about resource extraction in Australia. Aboriginal peoples have long been excluded from decisions about such developments on or near their Country. However, they often bear the environmental, cultural, social and personal impacts.

Our own research with Aboriginal communities examines their experiences of agreements with the resource industry. It suggests consultation processes don’t always translate into meaningful influence. Communities often shoulder the work of engagement, negotiation and compliance, while key decisions are made elsewhere.

Agreements don’t always lead to better outcomes given the costs and challenges of culturally sensitive, meaningful participation. Participating in agreements requires a lot of time and unpaid work. This includes coordinating community members to translate complex legal documents.

This work often falls on Elders and leaders, who bear logistical and administrative burdens. As AI systems expand, the challenge is ensuring that partnership isn’t burdensome and is more than box-ticking.

The time to act is now

Right now is the time to shape how Australia involves Indigenous peoples into AI development policies – before detrimental practices are locked in.

Consultation alone is not enough. Aboriginal people must have a seat at the table and be included before concept design to inform better outcomes for all. Aboriginal communities should have formal and resourced roles in decisions about land access, approvals and ownership.

It’s not too late to embed meaningful Indigenous leadership and governance in our AI development policies, but we must act now.The Conversation

Jenna Imad Harb, Research Fellow, School of Regulation and Global Governance, Australian National University and Shanine Ryan, Ngarluma Traditional Owner, Director of the Ngarluma Yindjibarndi Foundation Limited, Indigenous Knowledge

This article is republished from The Conversation under a Creative Commons license. Read the original article.

The collapse of a mountainside triggered Nepal’s devastating floods. As the region’s mountains heat up, it won’t be the last

aftermath of flood
Prabin Ranabhat/AFP via Getty
Tirthankar Ghosh, Monash University and Levan Tielidze, Monash University

On the morning of August 26, a section of mountain near Langtang Lirung peak in Nepal suddenly collapsed.

A huge mass of rock, ice and debris plunged roughly 1,200 metres into the valley below, producing a hugely destructive flood on the Lhende Khola river. The flow travelled almost 100 kilometres downstream, washing villages and bridges away. Almost 1,000 people died and thousands more are still missing across the Nepal-China border.

What caused it? At first, it looked like a glacier collapse. But emerging satellite and photographic evidence suggests a more complex picture – an avalanche of rock and ice, rather than a simple glacier collapse.

The mountain face now has a sharply defined scar after the collapse, clearly marking the boundary between the remaining slope and the section which failed.

This isn’t the first rock-ice avalanche in the Himalayas, but it is by far the most devastating. Unfortunately, it is unlikely to be the last. Rising temperatures due to climate change mean the permanently frozen slopes of mountains in the region may begin to melt and destabilise.

How did a mountain collapse?

The steep mountain face was topped by a glacier – a heavy river of ice. It’s likely that the steep slope of bedrock collapsed first, followed by the overhang of ice.

As this enormous mass fell into the valley, it created a tremendous amount of energy. This would likely have melted the ice in the avalanche and any in the valley, adding large volumes of faster-moving water to the flow and intensifying the debris flood.

The rugged Himalayan terrain made the disaster even worse by providing a steep, confined pathway, accelerating the mass of water, rock, dirt and ice as it flowed into the river.

A landslide followed the first collapse and a small lake has formed within the newly created depression in the valley. The site will remain unstable for some time.

Now that we know more about how the Langtang collapse became a cascading disaster, we can find parallels.

The closest example is the February 2021 rock-ice avalanche in Chamoli, India, which began when a huge landslide down Ronti Peak triggered an avalanche carrying an estimated 27 million cubic metres of rock and ice. This became a fast-moving debris flowing down a river valley. Over 200 people were killed or left missing.

The high mountains are changing

The Himalayas are the best known feature of the High Mountain Asia region – a large area with an average elevation of 4,000 metres which includes mountain ranges and the Tibetan plateau.

Despite its height, the region is not safe from climate change. In fact, change is happening faster here.

As air temperatures warm past 0°C more often, glaciers are beginning to melt. Snow and rainfall patterns are changing.

Permafrost – long-frozen earth and rock – is also becoming vulnerable. This matters most for steep mountain slopes, where fractured rock can be held together by ice.

When the ice melts, these ice-rock bonds can break. Water can begin to move down through long-frozen mountain slopes and bedrock. That means long-stable slopes can suddenly fail.

It’s common to picture glaciers as a slow-moving river of ice in a valley. But this high region is home to many hanging glaciers and smaller ice masses perched on steep mountain slopes.

These are at particular risk because they often sit high above valleys. If their rock support collapses, they can too. If they take rock, sediment and water with them, a simple glacial collapse can become a much larger avalanche or debris flow.

As the climate heats up, warmer air can lead to faster melting of the glacier and change how tightly it is coupled to its rocky bed. A small change in conditions at the glacier’s base can make it unstable.

Which areas are at highest risk?

Predicting the next big mountain or glacier collapse is a very complex task.

But we can improve our understanding of the landscapes and environmental conditions associated with such failures. Recent analysis of large rock and ice avalanches across the High Mountain Asia region gives us important insight.

Of the 60 avalanches analysed, 86% began on slopes steeper than 30° and at elevations above 3,000 metres. Almost two-thirds (65%) began in areas where permafrost was probable.

Earthquakes, underlying rock types and structures, and changes to rainfall can also make these avalanches more likely.

Across this region, rock–ice avalanches have been documented to occur more often in the Western Himalayas, including the Karakoram and Pamir Ranges, and across southern and eastern Tibet.

We will need to treat these rock-ice avalanches as a cascading hazard separate to isolated glacier collapses or landslides.

Could we be forewarned?

Footage from the disaster shows many people were caught unaware. If we could predict which glaciers or mountain faces are at highest risk, we could potentially save lives.

It is not an easy task. Signs a collapse is imminent such as rock deformation or fractures can often be subtle.

One approach could be combining field observations and seismic monitoring with data from satellites equipped with sensors able to observe changes in mountain faces and make optical and thermal infrared observations. New techniques such as the use of drones to monitor inaccessible or dangerous terrain are also worth exploring.

Observations must feed into early-warning systems capable of rapidly communicating the danger to communities downstream.

Because many Himalayan rivers cross national boundaries, nations will have to work together to strengthen data sharing, joint monitoring and coordinated early-warning systems.

The task is increasingly urgent. Climate change is loading the dice for more disasters in this high, cold region.The Conversation

Tirthankar Ghosh, Doctoral Student, School of Earth, Atmosphere and Environment, Monash University and Levan Tielidze, Research Fellow in Glacial Geomorphology, Monash University

This article is republished from The Conversation under a Creative Commons license. Read the original article.

Australia needs renewable energy fast – but building it is only half the battle

Cows in a paddock with a wind farm in the background.
AlbertPego/Getty
Mingming Cheng, Curtin University and Peta Ashworth, Curtin University

Australia’s energy transition has never been more urgent.

Aging coal-fired power stations are retiring and energy bills are rising sharply. To address this, the obvious solution is to build more renewable energy projects and the transmission infrastructure to connect them at scale.

But a major hurdle remains: community opposition. In regional areas, where most of the renewable infrastructure must go, locals are protesting against new transmission lines and are locking farm gates to keep developers off their property.

However, regional communities should not be forced to choose between supporting the national energy transition and protecting their land and livelihoods.

Our new research suggests we’re asking the wrong question. Instead of querying “if” communities support renewable energy, we should be asking “under what conditions” will they back such projects.

Not simply for or against

Our new study took a closer look at how three regional Western Australian communities – Busselton, Kojonup and Albany – view renewable energy infrastructure.

To do this, we analysed online discussions about solar and wind projects slated for their communities, each at different stages of development. The online discussions took place from January 2024 to May 2025 across a range of platforms, including Facebook and X (formerly Twitter), as well as relevant local and regional media websites, newspapers, community forums and online noticeboards.

Our results challenge the assumption that communities can simply be divided into those who are “for” clean energy and those who are adamantly “against” it.

In Busselton on WA’s south-west tip, renewable projects are still in the planning stage. There, local residents were most concerned about land use, property values and the visual appeal of landscapes. Many residents raised consultation as a key issue, with some expressing the view consultation came too late or did not give residents any opportunity to influence the outcome.

In the inland town of Kojonup, south-east of Perth, the Kojonup wind farm is currently being rolled out. This community’s concerns were decidedly practical: who actually gets the jobs? Who receives the financial benefits? Who bears any disruptions, such as visual disruption and lower property values? Financial fairness was a major concern for locals, with some landowners receiving benefits such as local investment opportunities while their neighbours got nothing except interrupted views.

The port city of Albany has been home to working wind farms for more than two decades. Here, the picture is very different. Albany’s wind farm supplies the equivalent of 80% of the city’s annual electricity needs and attracts an estimated 200,000 visitors a year. Community sentiment was largely positive, associating the wind farm with various environmental benefits including reduced reliance on coal and gas, as well as tourism and regional identity.

It’s worth noting not every host community will embrace renewable energy in such a linear pattern. However, our findings suggest community support is not necessarily fixed and can change over time as a project progresses.

Lessons from abroad

Overseas, other countries are already trialling ways of giving host communities a more tangible stake in the renewable energy shift.

Since 2014, the Scottish government recommends wind developers pay a minimum of £5,000 (roughly A$9500) annually for each megawatt of power a renewable project generates.

These payments are channelled into community funds, where a local committee decides how the funds are spent. If a project stretches across multiple regions, the funds are split based on how many megawatts of power each community hosts. However, these payments are not mandatory so not all renewable companies are contributing to community funds.

In Denmark, a global leader in wind energy development, several communities have established energy cooperatives. While each has a slightly different model, these cooperatives allow residents to own a share of renewable energy projects and, as a result, actively engage in the green transition.

Where to from here

These international examples underscore the need to engage with host communities in innovative and thoughtful ways.

Our research suggests these three strategies could help:

  1. recognising that if people resist local solar and wind projects, they are not simply “anti-renewables”

  2. engaging communities early, listening to their concerns about proposed renewable projects, involving them in decision-making processes and providing clear, transparent information about how any risks will be managed and benefits will be shared

  3. monitoring online discussions, particularly to identify emerging concerns before they become entrenched as opposition and potentially fracture trust between communities, government and renewables companies.

Australia, like many countries, is racing to shore up its renewable sector and shift away from fossil fuels. We must build more wind turbines and solar farms. But to ensure our energy transition works, building trust with local communities is just as crucial.The Conversation

Mingming Cheng, Professor, School of Management and Marketing, Curtin University and Peta Ashworth, Professor and Director, Curtin Institute for Energy Transition, Curtin University

This article is republished from The Conversation under a Creative Commons license. Read the original article.

Satellite images show how penguins’ diets are changing in response to Antarctic climate change

A black and white aquatic bird breaches the surface of the water.
An Adélie penguin swims through the ocean. Casey Youngflesh, CC BY
Casey Youngflesh, Clemson University

The color of penguin poop, as seen from space, is offering a new window into how the ecology and the environment of Antarctica are changing over time.

Adélie penguins are one of the most abundant predators in the Southern Ocean. They rely on food sources in the ocean, but nest on rocky outcrops all around the Antarctic continent.

Penguin colonies often have hundreds of thousands of nesting birds, which generate a lot of guano – so much so that it can be readily identified from space, using NASA’s Landsat satellites.

A multidisciplinary group of scholars that I led has used thousands of satellite images dating as far back as the 1980s to examine these patches of penguin guano, to reveal what these birds are eating and how changes in the environment are affecting their diets – which also affect their survival.

In particular, we found that when there is an abundance of sea ice at a colony, Adélie penguins there tend to rely more on small fish. When there is less sea ice, they depend more on krill, which are small shrimplike crustaceans.

A satellite view of a group of small islands with ice floating in the water between them shows that some of the islands are pink, while others are not.
A NASA graphic shows several of Antarctica’s Danger Islands stained pink by guano from Adélie penguins with a krill-rich diet. Without rookeries, those islands would look more like Darwin Island. NASA Earth Observatory/Michala Garrison

The color of food

Krill have a pink exoskeleton that penguins don’t fully digest, which contributes a rosy shade of pink to their guano. It is the color of guano that we can use to determine what penguins are eating.

This approach relies on a quantitative approach we developed that examines guano color and links that to the share of a penguin’s diet that is krill.

To develop the linkage, we collected penguin guano at several locations. With a spectrometer, we determined the color of each sample as a satellite would see it. This was done in a small makeshift lab on a ship in the Antarctic, which likely smells of penguin guano to this day. We analyzed what was in this guano, using tools from environmental chemistry, to determine the diet that had generated that color of guano.

A person bends over a table that holds several small patches of material of varying color.
Casey Youngflesh spreads out penguin guano in preparation for analysis of its color and evidence of what food it came from. Casey Youngflesh, CC BY

That information, along with some statistical modeling, allowed us to determine what penguins are eating based on the color of their guano as observed from satellites. More broadly, it provides a window into what is happening in the larger Antarctic marine food web – information typically hidden under the surface of the Southern Ocean. To our knowledge, this is the first effort to directly monitor what animals are eating from space.

An overhead view shows two circles of a penguin colony on land near a rocky, icy shore.
A view from a drone shows how penguin colonies, lower left, differ in color from their surrounding terrain. Thomas Sayre-McCord/WHOI/MIT, CC BY

Using information from around 4,000 satellite images, we looked at how penguins’ diets varied over both time and space. We found that penguins do eat different things across the Antarctic continent, and that what they eat varies both across the year as well as from one year to the next.

Links between sea ice, food webs and penguin populations

Our data reveals how climate change is shifting penguins’ diets and how the Antarctic food web as a whole is changing.

Since the 2010s, sea ice has declined precipitously around the continent, with several years setting new historical sea ice minimums. Less sea ice means fewer fish, which is bad news for penguins: Adélie penguin chicks are typically heavier when fed fish as opposed to krill, and heavier chicks are more likely to survive into adulthood.

Our findings indicate that in locations where penguins eat less fish, the number of penguins has declined over the past few decades across the species’ entire range. By contrast, penguin colonies that eat more fish are more likely to be stable or increasing.

A lot of penguins sit perched on top of gray fuzzy bundles that are their chicks, amid rocks, dirt and guano.
A colony of Adélie penguins on their nests, on King George Island in Antarctica. Michael Polito, University of California Santa Cruz, CC BY

Unfortunately, large-scale declines in sea ice are projected to continue into the future. Adélie penguins are also now facing increased competition for fish and krill from other marine life and from humans.

For example, in the Antarctic Peninsula region, the area directly below South America, baleen whale populations, which feed largely on krill, have rebounded substantially since the end of commercial whaling decades ago. Gentoo penguins are shifting their range from the sub-Antarctic southward to the Antarctic as the climate warms, adding to the numbers of predators hunting in those waters.

Fishing trawlers are also now harvesting large quantities of krill to be used in fish feed and human dietary supplements, which may put additional pressures on Adélie penguins in these regions.

A close-up photo shows a penguin bending forward and opening its beak toward two tiny gray-and-black chicks, which are reaching upward with open mouths.
An Adélie penguin adult feeds two small chicks on one of the Danger Islands in Antarctica. Michael Polito, University of California Santa Cruz, CC BY

The power of big data

Only by using thousands of satellite images could our research team understand how Adélie penguins’ diets vary across the range of the species, how it shifts over the seasons, and how it is responding to a changing environment over the past several decades.

Information from satellites is particularly valuable for remote and hard-to-reach areas like Antarctica’s penguin colonies, as other methods of collecting this data would take massive amounts of personnel, planning and travel and survival logistics.

As satellite technologies continue to improve, with increasing resolution, shorter intervals between images and new sensors for collecting information, there are opportunities to fundamentally change how we monitor some wildlife, providing critical information about how the world is changing and how humanity might respond to these changes.The Conversation

Casey Youngflesh, Assistant Professor of Biological Sciences, Clemson University

This article is republished from The Conversation under a Creative Commons license. Read the original article.

Extreme heat is taking a toll on firefighters as wildfires stretch crews to the limit

Firefighters working behind a low line of flames.
Wildland firefighters light a backfire while battling a fire near Mariposa, Calif., in 2022. David McNew/AFP via Getty Images
Julian L. Gallegos, Purdue University

When a wildfire threatens a community, most people don’t think to ask whether the firefighters coming to help slept enough the night before, recovered from the previous day’s shift or have enough energy left for another day on the fire line. They simply expect firefighters to show up.

But that workforce is increasingly being stretched to its limits.

The U.S. national fire preparedness level has been at 5 for weeks in summer 2026, its highest level, suggesting firefighting resources are fully committed and some regions may need emergency staffing measures to meet the demand. Crews were battling more than 90 large fires in late August, and firefighters in the Southwest and Texas faced daytime temperatures over 100 degrees Fahrenheit (38 degrees Celius) at times.

Firefighters cut fireline while carrying heavy packs.
Cutting fire lines to prevent wildfires from spreading is physically exhausting work, and firefighters often work long shifts. Joe Bradshaw/BLM

In conditions like this, the unrelenting heat, stress and smoke take a toll on firefighters’ bodies.

Training, fitness and protective equipment allow firefighters to work in these extraordinary environments. But as a nurse practitioner, firefighter and founder of Purdue University’s FIRE Lab, I know too well that none of that makes the human body’s capabilities limitless.

Heat hits firefighters from 3 directions

Wildland firefighters face heat from the environment, the fire and their own bodies.

Hiking steep terrain with heavy equipment, clearing brush and cutting fire line to stop fires from spreading creates internal metabolic heat. Sun and high air temperatures add environmental heat, while flames and smoldering fuels contribute radiant heat.

The body responds by sending more blood toward the skin to release that heat while continuing to supply oxygen to working muscles. The heart works harder to support both jobs.

As fluid losses increase, the volume of blood circulating through the body can fall, the heart rate rises, and the work of fighting fires feels harder.

An infographic discusses ways firefighters face heat from the fire, the environment and their own bodies from the exertion when battling wildfires.
How heat affects wildland firefighters. Purdue University FIRE Lab

Field studies show how this strain can become severe. In one study of 221 wildland firefighters on the job, 61% reached a core temperature of at least 100 F (38 C). About 50% reached a physiological strain index of 6 or greater on a 0-to-10 scale that combines heart rate and core temperature to measure how hard the body is working to cope with heat. Among those whose body temperatures crossed 100 F, the majority remained above that temperature for more than 30 minutes.

A core temperature of 100 F does not by itself mean heat stroke, but it signals substantial physiological strain. Staying hydrated helps the body sweat and keep blood circulating, but even a fully hydrated firefighter can overheat when the body gains and produces heat faster than it can release it.

Immediate consequences can develop quickly

Heat strain may begin with fatigue, headache, dizziness, weakness or nausea and progress to heat exhaustion or heat stroke. Severe hyperthermia can affect the brain, heart, kidneys and liver.

Wildland firefighters can also face rhabdomyolysis, a breakdown of skeletal muscle that can contribute to kidney injury. The National Institute for Occupational Safety and Health reported 62 severe cases among wildland firefighters from 2010 to 2020 and cautioned that the true number was probably higher.

A line of firefighters in soot- and dirt-stained yellow jackets walk along a road carrying equipment.
Fighting wildfires often means walking miles in steep terrain, carrying the equipment and protective gear firefighters need. These firefighters are working on the Timber Fire near Big Sur, Calif., in August 2026. Andrew Avitt/U.S. Forest Service

Heat adds to fatigue when firefighters must anticipate fire behavior and make rapid decisions.

A 2025 field study found that wildland firefighters averaged 13.8-hour shifts on days when they were fighting fires and got around 6.7 hours of sleep. Poorer sleep and longer shifts were associated with reduced cognitive function, which can affect a firefighter’s ability to make split-second calls, such as when to retreat from an escalating fire.

Effects stay with bodies beyond one shift

The effects of heat and exhaustion can also add up. A firefighter can finish a shift hot, smoke-exposed and physically depleted, sleep in a warm camp and return to the line before fully recovering. Repeating that pattern across days and fire seasons may place ongoing strain on the heart, lungs and kidneys.

Smoke adds another health risk. Wildland firefighters commonly work in smoke without the kind of protection that firefighters use when fighting blazes inside buildings.

A 2019 exposure-modeling study estimated that, depending on the number of fire days worked over a career, cumulative smoke exposure could increase a wildland firefighter’s risk of dying from lung cancer by 8% to 43% and dying from cardiovascular disease by 16% to 30%. These are estimates, but they show why career-long exposure deserves attention.

Firefighters on air mattresses with tents in the background.
Getting quality rest between shifts isn’t always easy during multiday campaigns fighting major fires. AP Photo/Ted S. Warren

Kidney health is another emerging concern. A 2025 study of 39 wildland firefighters found temporary decreases in kidney function and changes in kidney-injury biomarkers during one midseason fire incident. More research is needed to determine whether firefighting over seasons and years can lead to persistent kidney damage.

These findings raise an important occupational health question: What happens when heat, dehydration, smoke, sleep disruption and extreme physical exertion accumulate not only across one incident but across an entire career?

How to lower the risk

The heat isn’t going away, but there are ways wildfire management agencies can reduce the risk to firefighters.

First, firefighter health should be an important part of national wildfire readiness policies. Having adequate staffing so firefighters aren’t overworked and have meaningful enough recovery time to rehydrate, cool down and sleep between shifts are important. So are conditions that allow real sleep between shifts.

Monitoring firefighters’ health can also help catch early warning signs, such as kidney stress or burnout.

The public can also help by reducing the likelihood of high-stress fire situations.

The National Interagency Fire Center estimates that about 85% of U.S. wildfires are caused by human activities. Some of those can be avoided by fully extinguishing campfires, checking local fire restrictions, avoiding spark-producing activities on dry, windy days when fire risk is high, and maintaining vehicles and trailers so metal does not drag and ignite vegetation.

If you live in wildfire-prone country, creating defensible space and reducing combustible material around your home can reduce the fuel for fires. Evacuating promptly in an emergency also reduces the likelihood firefighters will have to put themselves in high-stress situations to rescue you.

We all expect firefighters to be there when the worst happens. Making sure they can do their jobs and stay healthy will allow them to continue to show up.The Conversation

Julian L. Gallegos, Assistant Professor of Nursing, Purdue University

This article is republished from The Conversation under a Creative Commons license. Read the original article.

Galápagos corals show El Niño events are more extreme now than in past 1,000 years – here’s how my team made the discovery

A scuba diver takes a coral sample from the ocean bottom.
A NOAA scientist takes a coral sample in the Galapagos Islands. The process does not injure the colony, which grows back. Atlantic Oceanographic and Meteorological Laboratory - NOAA
Julia Cole, University of Michigan

Temperatures have warmed dramatically across the equatorial Pacific Ocean in 2026, signaling the onset of a strong and potentially historic El Niño. These events can affect weather around the world, and the intensity of recent El Niño events is raising alarm that, as global temperatures rise, they are becoming stronger and more destructive.

To understand how these climate patterns are changing, we need to understand what happened during El Niño events in the past, but observations go back only a few decades. So, my colleagues and I went to the Galápagos Islands – at the heart of the El Niño pattern – to find answers from some of nature’s best record keepers: corals.

In records preserved by living and ancient fossil corals, we found that, on average, El Niño events have been stronger in the past 40 years than at any time in the past millennium, with higher temperatures that lead to more powerful effects on weather.

That intensification also coincides with human-caused global warming.

Our results, just published in the journal Science, suggest that the 1982-83 and 1997-98 El Niños – two of the strongest in recent memory – may be harbingers of more extreme events to come as the planet warms.

A chart shows rising global temperatures and El Niño conditions over time.
Our World in Data, CC BY

El Niño comes for the Galapagos

One of the strongest El Niños hit in 1982, with devastating consequences for the Galápagos Islands. It triggered a marine heat wave that reverberated through one of the most distinctive and unspoiled ecosystems on the planet.

Exceptionally warm surface water blocked the usual upwelling of cool, nutrient-rich water that fuels the food chain for marine life. The result ravaged communities that rely on the ocean – fish, birds, marine mammals, and people who fish for their livelihoods throughout the eastern tropical Pacific. In the extraordinary heat, more than 95% of Galápagos corals died.

The heat wave was caused by an exceptionally strong El Niño event, part of a climate pattern that begins in the eastern tropical Pacific Ocean, around the Galápagos Islands, as the trade winds shift. El Niño’s warm ocean water alters the atmospheric circulation above, diverting storm tracks and changing patterns of floods, droughts and tropical storms around the globe.

Fish swim over a expanses of corals.
The Galápagos Islands are known for their astounding marine biodiversity, a result of high nutrients and the mixing of cool and warm waters. Greg Asner/DivePhoto.org

The 1982-83 El Niño contributed to climate extremes worldwide, from flooding in Kenya and Peru to drought in Indonesia and Brazil, costing the global economy as much as US$4 trillion by some estimates. A similarly strong El Niño in 1997-98 resulted in 23,000 deaths from disease and climate disasters.

But we wanted to know: Are such powerful El Niño events unusual in the context of history?

Even in 1983, scientists were surprised to find that such a strong event had been underway. Historical records of El Niño are sparse before the era of satellite observations. Fortunately, long-lived corals growing in the tropical Pacific can provide a history of El Niño that extends our view into the past.

How corals record history

As corals grow, they preserve a record of local ocean temperatures over time. In the Galápagos, because of their location, that record reveals the history of El Niño events and of their cooler counterpart, La Niña.

Like trees that produce annual growth rings, corals add skeletal layers of calcium carbonate year after year. The alternating bands of higher and lower density reveal changes in the coral’s growth rate during each year and can serve as a timekeeper. The history of the ocean temperature is embedded in the chemical composition of the skeleton itself.

To track the history of water temperatures, we measured two chemical parameters – the ratio of heavy to light oxygen isotopes and the ratio of strontium to calcium – both of which reflect the seawater temperature in which the coral grew.

Three maps showing temperature differences in the difference phases: neutral, El Niño and La Niña
Three sea surface temperature maps show how Pacific Ocean temperatures change between El Niño, La Niña and neutral patterns. The Galápagos Islands are within the small black circle. During El Niño, trade winds weaken, suppressing the upwelling of cool water and allowing temperatures to rise. Temperatures are in Celsius. NOAA

In the Galápagos, because of the islands’ location, the sea surface temperature swings between warm El Niño years and colder La Niña years, when upwelling of nutrients is stronger.

Illustration shows upwelling
The Galápagos Islands sit in a region of strong upwelling, where nutrient-rich deep waters rise to the surface. This upwelling results from a combination of the local trade winds and the surfacing of a deep current as it collides with the islands’ mass. The nutrients fuel phytoplankton blooms that provide food for fish, birds and other marine life. Julia Cole, based on original illustration by the Woods Hole Oceanographic Institution
Two maps show very low phytoplankton activity at the end of an El Niño and high again during La Niña.
Satellite images of phytoplankton around the Galápagos Islands show how exceptionally warm El Niño events, left, reduce the upwelling of nutrients that phytoplankton need, compared to more normal conditions, right, a few months later. NOAA Climate.gov, based on SeaWiFS data provided by Norm Kuring, NASA GSFC

The largest living corals in the Galápagos grow in the northern islands of Wolf and Darwin, in water 20 to 50 feet deep. To study their history, we dived down and took core samples from long-lived corals, some 8 to 10 feet tall.

Every core we drilled from a living coral showed evidence in its calcified skeleton that the coral had suffered during the 1982-83 El Niño event. We saw obvious “death horizons” – dense layers of calcified material produced by other reef organisms such as algae, gastropods and barnacles interrupting the lattice of the skeleton.

A CT image, left, and photo, right, of a section of coral from Wolf Island shows the ‘death horizon,’ when extreme heat bleached and then killed the corals living there. The coral colony later regrew over the dead surface.

We also took samples of fossil corals around the archipelago – mostly dead coral boulders found along the islands’ shorelines. Radiometric dating told us that these fossil corals were up to 4,500 years old. Those samples provide an even deeper view of El Niño’s history.

Back in the lab, we sliced the coral cores lengthwise into slabs and used a drill to extract powdered samples, each representing about one month’s growth, along a path from youngest to oldest. We analyzed the geochemistry of each sample. In the chemical ratios from thousands of samples, we found seasonal cycles spanning many decades and exceptional warm and cold years that revealed a unique history of El Niño and La Niña events.

A large fossil on land.
The Galápagos Islands have many large fossil corals that preserve temperature histories going back millennia. Gerald and Buff Corsi © California Academy of Sciences
A flat surface that looks like rock with clear growth bands that look like tree rings.
A fossil coral in the field shows annual growth bands. Julia Cole

A history of ENSO through time emerges

Our data show clearly that the strength of the El Niño-Southern Oscillation has intensified as global temperatures have warmed.

The chemistry of the corals revealed that El Niño events from the past 40 years were stronger than at any other time sampled in the past millennium.

The coral data aligns with ocean temperatures measured from thermometers over the past century. But the coral records extend much further back in time, providing long-term context to show that modern El Niño events are more extreme than before the industrial era began.

A line chart shows El Niño and La Niña strength changes over time.
The study found that the strength of El Niño or La Niña paralleled global temperature change over the past millennium. The strength, measured by coral geochemistry, is indicated by the colored circles and triangles: The colors denote the island location, and the shape indicates the type of geochemistry used. Triangles show results derived from the ratio of strontium to calcium, and circles show results from the ratio of oxygen isotopes. The red line indicates the global temperature estimated from other paleoclimate data. Coral data is plotted as the standard deviation of reconstructed Galápagos temperature on left axis, and global temperature data is plotted as deviations from the 1961-1990 average on the right axis. Julia Cole

The El Niño intensification we observed, starting in the mid- to late 20th century, is also greater than what nearly all climate models suggest would result from natural causes. It appears to be closely connected to human-caused global warming – a conclusion in line with expectations from most climate models.

Not all models anticipate El Niños strengthening as the climate warms, but our data shows that unusual strengthening has accompanied recent warming – an association that may allow scientists to identify models that most closely track observations.

Looking ahead

A stronger El Niño-Southern Oscillation means more intense and damaging climate extremes across the globe. If humanity can anticipate those hazards, we can prepare and perhaps avoid the worst damage.

Fortunately, scientists understand enough about El Niño and La Niña events today to be able to forecast them up to a year in advance. But such predictions depend on continuous, careful climate measurements from satellites and buoys across the remote tropical Pacific, coupled with continuous improvements in climate modeling and forecasting capabilities.

Those capabilities are now more important than ever as global warming accelerates.The Conversation

Julia Cole, Professor of Earth and Environmental Science, University of Michigan

This article is republished from The Conversation under a Creative Commons license. Read the original article.

How underwater ‘booms’ could provide earlier warning of deadly volcanic tsunamis

NASA Worldview
Shane Cronin, University of Auckland, Waipapa Taumata Rau and Jose Carlos Borrero, University of Southern California

The massive January 2022 eruption of Hunga volcano in the Kingdom of Tonga took the world by surprise.

It blasted a plume more than 50km into the atmosphere, sent pressure waves around the globe and generated a series of tsunamis, devastating parts of Tonga and killing at least three people.

But one of the most important things we’ve learned since this historic event is that these tsunamis did not all stem from the same cause.

The first were generated by enormous explosions during the opening stages of the eruption. On nearby Tongatapu, waves with run-ups of one to four metres began arriving within minutes.

Then, more than an hour later, something much more destructive happened. A tsunami with run-ups reaching 18 to 40 metres struck islands within 100km of Hunga, destroying resorts and villages across southern and central Tonga.

Our newly published research shows this largest tsunami was generated not by another explosion, but by the sudden collapse of the volcano’s caldera – and that the collapse produced an underwater sound detectable thousands of kilometres away.

That finding could point to a new way of warning communities about some of the most unpredictable types of tsunamis on Earth.

Listening to an underwater volcano

Monitoring submarine volcanoes is notoriously difficult. There are hundreds scattered around the Pacific “Ring of Fire”, yet we know relatively little about their state of activity – and even less about how to respond when they erupt.

Satellites can detect changes in heat and gas emissions, along with eruption plumes when clouds don’t obscure the view. These observations can provide timely warnings of eruptions and help protect aircraft.

But satellites cannot tell us whether a deadly tsunami is on its way. Nor are conventional seismometers necessarily much help.

The closest seismometer to Hunga during the 2022 eruption was in Fiji, about 750km away. At that distance, many of the seismic signals produced by volcanic processes are poorly transmitted through the Earth.

So instead, we listened to what Hunga was doing in the ocean.

Underwater sound travels extremely efficiently over long distances as hydro-acoustic signals known as tertiary waves, or T-waves. An isolated volcano rising from the ocean floor can effectively act like a bell, radiating the sounds of violent underwater processes through the surrounding ocean.

We re-analysed records from 14 seismic stations around the southwest Pacific, some as far as 2,600km from Hunga.

During the first hour of the eruption, we could “hear” submarine landslide flows racing down the volcano’s flanks. These flows were powerful enough to destroy submarine communications cables and their acoustic signals could be detected hundreds of kilometres away.

But the loudest underwater signal was still to come.

The sound of a volcano collapsing

At about 6.28pm Tonga time, the centre of Hunga began collapsing in on itself.

The collapse ultimately produced a caldera about 4km wide and more than 850 metres deep. Moving such an enormous volume of rock and seawater generated the largest local tsunami of the eruption.

Yet remarkably, the collapse was only weakly detected through conventional seismic monitoring.

Underwater, it was a different story. The collapse generated an enormous T-wave that radiated across the Pacific. We detected it at 14 stations, including sites more than 2,000km away.

The strongest part of the signal lasted about five minutes, giving us an indication of just how rapidly the main collapse occurred.

But to establish that this collapse had generated the devastating tsunami, we needed to know precisely when that wave reached Tonga. That required a rather different kind of evidence.

The tower that stopped transmitting

At Kanokupolu, on the western side of Tongatapu, a telecommunications tower stood 180 metres inland and about 13 metres above sea level.

The earlier tsunami had already swept ashore and residents had evacuated, but the tower remained standing. A weather station attached to it sent its last scheduled data transmission at 6pm.

Eventually, the much larger tsunami arrived. It flattened the tower and tore it apart, with pieces later found hundreds of metres further inland.

But exactly when had that happened?

Our team worked with Tonga Communications Corporation to examine data traffic through the tower. The answer was remarkably precise: communications stopped at 6:45:24pm.

That timestamp provided another piece of the puzzle. The huge underwater acoustic signal indicated Hunga’s caldera had begun collapsing at about 6.28pm.

The destruction of the tower roughly 17 minutes later was consistent with the time needed for the resulting tsunami to develop and travel across the roughly 60km separating Hunga from western Tongatapu.

This satellite image shows ash-covered homes and buildings on the Tongan island of Tongatapu, days after the eruption of the Hunga Tonga-Hunga Ha'apai volcano on January 14, 2022. Maxar/Getty Images

Eyewitness accounts provided another check. People had experienced the earlier, smaller waves and had time to evacuate before the catastrophic tsunami arrived.

All of this evidence enabled us to reconstruct something that conventional seismic monitoring had largely missed: a sudden submarine caldera collapse that generated the eruption’s most destructive local tsunami.

Sound waves travel through the ocean at around 1.5km per second – more than seven times faster than a tsunami.

If monitoring systems can automatically recognise and locate these signals, they could provide early warning of volcanic tsunamis – much as existing systems do for those triggered by earthquakes.The Conversation

Shane Cronin, Professor of Earth Sciences, University of Auckland, Waipapa Taumata Rau and Jose Carlos Borrero, Adjunct Assistant Research Professor, Department of Civil and Environmental Engineering, University of Southern California

This article is republished from The Conversation under a Creative Commons license. Read the original article.

More trees are needed to cool down European cities in heatwaves – but they must be planted nearer to homes

Puerta del Sol square in Madrid with people walking across the square.
Madrid could benefit from more trees to create shade in the summer. Mistervlad/Shutterstock
Thami Croeser, RMIT University and Simon Hodder, Loughborough University

Heatwaves claimed the lives of tens of thousands of people in Europe’s capital cities this summer, as they experienced record temperatures.

In London, emergency wards filled with elderly patients injured after fainting in the heat. Meanwhile, the dry weather created subsidence and left homes with cracks.

In Paris temperatures exceeded 40°C in late June and people struggled to carry on their lives, and in Madrid, heatwaves burned thousands of hectares on the outskirts of the city.

How trees can help

Thami carried out preliminary research on the results of extreme heat on European cities this summer. The study looked into how many buildings have adequate shade from trees. The results were striking.

In London, Paris and Madrid over 90% of buildings did not have enough shade around them to prevent urban heat island effects. These were among the worst results in cities we studied, but even the best performers had a majority of residents without adequate heat protection – cities like Hamburg (56% unprotected) and Barcelona (70% unprotected).

This builds on past research that shows how major cities around the world – including in Europe – tend to struggle to reach useful levels of tree canopies to create shade close to homes and workplaces. It suggests that that homes should have a view of three trees and be within a 300 m walk of a park.

Early results for my research suggests that huge portions of European cities are exposed to avoidable heat island effects.

Map showing tree cover and heat in European cities

How urban heat islands work

On many days during summer 2026 it didn’t get much cooler in the evening. This is because of what is known as the urban heat island effect. Cities typically lack shade, due to high rates of tree removal, sparse planting, and poor tree health and there are vast amounts of asphalt, clay and concrete. These are almost the perfect materials to soak up and hold heat from all that direct sunshine. Unshaded asphalt can reach over 70°C on heatwave days.

Even after sunset, cities stay hot because roads, buildings and footpaths begin to radiate their absorbed heat back at us as they cool. The urban heat island effect can add significantly to ambient temperatures, making a day that is already very hot (perhaps 35°C) even more dangerous in high-asphalt, low shade locations (over 40°C).

What could help?

Tree shading is an effective strategy to address this urban heat, with a range of other mental and physical health benefits to local residents. Trees prevent solar radiation reaching heat-absorbing materials such as asphalt, and also keep the sun off our bodies. Tree shade has been shown to reduce the heat absorbed by pedestrians by up to 18°C.

Healthy trees also push water out of their leaves as they photosynthesise, which soaks up heat as it evaporates. This evaporative cooling effect adds an extra few degrees of cooling, in addition to shading people and preventing heat island effects, even during heatwaves as long as trees still have access to water.

Where trees are needed

Planting more trees in cities in the wake of this summer’s heatwaves is going to help cool urban areas down. The thinktank, the Create Streets Foundation, found the temperature on an exposed paved area in London during one heatwave was 55°C but was 25-30°C in a shaded area metres away.

Looking at a city such as London, you might argue that it already has plenty of trees: around 8 million.

But trees are only effective tools against urban heat when they’re close to homes. A lush shady park 800m away isn’t going to prevent dangerous localised heat island effects for you and your neighbours.

The other crucial factor is that there are thresholds of shade cover that have to be reached for trees to actually offer substantial cooling. A few isolated trees creating small islands of shade aren’t enough. Adding more tree canopy has been shown to be effective at preventing urban heat islands when it reaches 30-40% overall shade cover, within 60m of homes and workplaces.

It will also be important to plant trees that are best able to cope with increasingly hot temperatures in Europe.

Adding just a few degrees to an already hot day sharply ramps up the danger that heat poses. In locations where heat islands bump up the ambient air temperature from 33°C to 37°C, or 35°C to 41°C, there’s an increase in patients attending hospital admissions’ rooms due to heat related illness. When air temperature increases above 35°C the human body’s ability to manage the heat is greatly reduced; cardiovascular strain, dehydration, potentially leading to heatstroke and the need for medical intervention.

When it makes nights hotter there are other ramifications. It is during the cooler night hours that the body loses heat to reset for the following day. If the body is still trying to cope with warm temperatures, 24°C and above, this impacts recovery and impairs sleep quality. This means we start the next day in deficit, both physiologically and cognitively, to cope with another hot day. Repeated exposure to days of high heat mean that the deficit builds over time.

Adding more trees works

Medellin in Colombia is an example of what happens when more plants are added to urban streets.

In just a few years, millions of plants and over 12,500 trees were added to form a network of lush greenways across Colombia’s second largest city.

This project has resulted in significant drops in temperature (of 4.5°C in some areas, and 2°C citywide).

There are signs that Paris and London are aware they need to make changes. The recently announced Heat Ready London plan includes a focus on urban greening.

Paris is already starting to add more green space. The city’s school streets programme not only creates safe, car-free areas close to local schools, but also has added more trees. Evidence already suggests that surfaces in school streets are 5°C cooler than their traffic-heavy counterparts, with fewer trees.

As Europe prepares for more hot summers, planting trees close to homes needs to be high on the agenda to help people cope.The Conversation

Thami Croeser, Vice-Chancellor's Research Fellow, Centre for Urban Research, RMIT University and Simon Hodder, Professor in Environmental Ergonomics, Loughborough University

This article is republished from The Conversation under a Creative Commons license. Read the original article.

Using a radar satellite to track emperor penguins in winter is changing our understanding of the species

An emperor penguin in the Antarctic.
Grant Macdonald, Durham University

Freely available satellite radar imaging is being used for the first time to help track colonies of endangered emperor penguins in Antarctica throughout the winter months.

Typically satellite images need sunlight to be useful, and Antarctica is dark in the winter. This has meant that colonies have been hidden at a critical time in the emperor penguin breeding cycle, when eggs are laid, chicks hatch and adults take part in those iconic huddles.

Almost 70 colonies of emperor penguins, many of which have never been visited by humans, occupy the sea ice that is fastened to the coastline surrounding Antarctica.

Now using synthetic aperture radar (SAR), an instrument operating on satellites that sends microwave pulses down to Earth, and measures how those pulses return, our research team has been able to track what the penguins do during these months.

Unlike other forms of satellite imagery, SAR is not reliant on sunlight, or affected by cloud, and therefore provides radar imagery of Antarctica through the dark polar winter.

SAR’s signal is sensitive to the properties of what it interacts with, and has been used for years in the poles to research things like the properties of sea ice and melt on glaciers.

When looking at SAR images from the free European Space Agency satellite, Sentinel-1, showing the location of an emperor penguin colony during winter, my team started to notice a bright white splodge of pixels moving around against a backdrop of dark, smooth sea ice.

Features like icebergs or rough sea ice can look bright in SAR imagery, but it didn’t make sense for those to be moving around at that time of year, when the sea ice was fixed and stable. Could it be the emperor penguin colony?

We soon found the same thing at the locations of other colonies – clusters of bright moving pixels on stable ice. We were then able to obtain optical images from September when the sunlight first starts returning, and compare them with the SAR, and confirmed it was indeed the colonies we were observing.

penguins standing on snowy mound, ice landscape in background, blue sky
A group of adult and chick emperor penguins at Snow Hill Island, Antarctica. Peter Fretwell, British Antarctic Survey., CC BY

Tracking through the whole year

This finding opened up an exciting opportunity to track colonies throughout the whole breeding cycle, by combining SAR images in winter with optical images in spring/summer, and all using freely available data that has been routinely collected for years.

We went back through eight years, from 2017 to 2024, and followed three of the largest colonies year-round. We were able to follow their movement, sometimes even daily from early in the winter until chicks grow their first feathers in December and January.

Emperor penguin colonies in Sentinel-1 SAR imagery during winter. This image shows the Cape Washington colony.
Emperor penguin colonies in Sentinel-1 SAR imagery during winter. This image shows the Cape Washington colony. European Space Agency., CC BY

We observed that colonies were typically less mobile in the winter, before spreading out and moving greater distances in the spring and summer. Interestingly, we found that the Atka Bay colony moved up from the sea ice onto the glacier ice that flows from the continent in seven of the eight years in the early spring. The colony did this despite the sea ice – the typically preferred habitat for the species – being stable. We need more research to understand why this is.

Satellite remote sensing has been a crucial tool for observing the emperor penguins in the summer months since 2009. It was discovered then that colonies could be found in satellite images because of the dark guano stains they leave on the snow and ice. Overall, these observations have revolutionised our understanding of the species and have led to the discovery of many more colonies.

The Atka Bay colony of emperor penguins in satellite radar imagery during winter
The Atka Bay colony of emperor penguins in satellite radar imagery during winter. European Space Agency., CC BY

After a period of stability, Antarctic sea ice has declined markedly since 2016 and likely entered a new state, characterised by lower extent and increased instability. Earlier this year, emperor penguins were added to the International Union for Conservation of Nature’s red list and classified as endangered, predominantly due to projected declines in sea ice.

This makes better understanding and monitoring of emperor penguins more important than ever. The ability to observe colonies throughout the breeding cycle using freely available, routinely collected satellite data creates opportunities to better understand their response to changing environmental conditions.The Conversation

Grant Macdonald, Postdoctoral Researcher, Department of Geography, Durham University

This article is republished from The Conversation under a Creative Commons license. Read the original article.

3D scans of Tasmanian tiger’s skull reveal it had crocodile‑style snapping jaws

Vera Weisbecker, Flinders University; Andrew Pask, The University of Melbourne, and Douglass S Rovinsky, Monash University

Some 90 years after the death of the last documented thylacine – better known as the Tasmanian tiger – the species remains a global symbol of human-made extinction.

The carnivorous marsupial fell victim to 19th-century colonists’ perception that unfamiliar creatures were primitive, vermin-like imitations of more familiar European animals. The species was later exterminated due to sensationalist claims that it was a ferocious, wolf-like predator of sheep.

However, our new study, published in Nature Communications, suggests the thylacine defied the colonialists’ assumptions in every way. It was unique among modern predatory mammals by subduing its prey with high-impact snaps of slender, oversized jaws.

Our focus was on one of the most widely cited cases of evolutionary convergence – the dog-shaped skull of the thylacine, which inspired its species epithet cynocephalus (“dog-head”). This is a striking similarity as thylacines are separated from dogs by more than 120 million years of evolution.

So we set out to understand how deep the similarity really goes.

Overview over the mammalian tree of life with thylacine in pink and wolf in orange. Modified from work by OrthoMaM: A database of orthologous genomic markers for placental mammal phylogenetics. Ranwez et al. (2007), CC BY-SA

A massive head with a flimsy face

We used 3D shape analysis to compare scanned thylacine skulls from museums around the world with those of other predatory mammals. This revealed that different regions of the thylacine’s skull resemble those of several other animals.

The thylacine’s long and thin snout looks pretty fragile, most like that of small foxes and jackals. By contrast, the back of the thylacine’s skull resembles that of wolves, dingos and dholes (also known as the Asiatic wild dog).

But the standout feature of this odd patchwork was the thylacine’s enormous head. Its relatively puny 17 kilogram body carried a skull as large as that of wolves, which are more than twice the thylacine’s weight.

So why this skinny jaw on an outsized head?

We suspect this combination allowed thylacines to subdue their prey with powerful snapping bites. Thylacine jaws are clearly built for speed: the longer a jaw is, the faster its tip moves during biting.

Combined with the animal’s famously large gape, this should increase the impact of the strike. Long jaws like this are usually quite weak, but the huge size of the thylacine’s skull would have added enough substance to withstand lethal snaps into potentially unsuspecting bandicoots.

A black and white image of a small tiger-like animal with black stripes on its back and its mouth wide open.
A yawning thylacine at Beaumaris (now Hobart) Zoo taken in 1933. Dr David Fleay

The mammalian answer to crocodiles?

But it is the features that are not found in other predatory mammals that may have taken the thylacine’s snaps to a new deadly level.

The thylacine’s upper jaw is exceptionally tall, with a distinctive “pinched” hourglass shape at the tip. This combination is perfect for resisting the stress of high-impact, upwards-directed bites. It also matches earlier results that thylacine canine teeth seem most suited to puncturing, crushing bites (rather than pulling, tearing, or holding).

Thylacines were probably the last modern predatory mammals to sport such a tall, mace-like snout. But similar jaw types are found across other vertebrates, such as crocodiles, and are usually interpreted as adaptations for hunting fast-moving prey.

But some extinct mammals also had thylacine-like snouts, most notably in the gigantic extinct predator Andrewsarchus.

Our results are particularly tantalising in view of earlier genomic work which suggested that natural selection acted on regulatory genes in some shared developmental pathways of wolves and thylacines.

It is possible these genomic similarities are behind some of the shared aspects of skull shape between wolves and thylacines. However, as we know wolves and thylacines did not fill the same ecological niche, we might ask how these genomic convergences produced such a uniquely specialised marsupial predator.

Skulls of a grey wolf, thylacine and red fox seen side by side.
Even though wolves, thylacines and red foxes are separated by millions of years of evolution, their skulls show striking similarities. Vera Weisbecker

A lesson for urgent and thoughtful future science

Our results highlight – yet again – that the thylacine’s eradication targeted an animal that only existed in the early colonial imagination. But they are also a timely reminder we cannot afford to repeat this mistake through negligence.

Australia has the worst mammal extinction rate in the world. Its wildlife faces escalating threats from environmental degradation and climate change, as well as new threats such as bird flu.

Museum-based research like ours is needed to illustrate how these statistics reflect irreplaceable biodiversity lost with every extinction.

But we also need to remember Western science is only part of the story – respectfully requesting knowledge from Indigenous custodians about the unique Australian wildlife should be key to our future research.

After all, the people who lived alongside thylacines for tens of thousands of years knew exactly what kind of animal it was.The Conversation

Vera Weisbecker, Professor in Evolutionary Biology, College of Science and Engineering, Flinders University; Andrew Pask, Professor, School of BioSciences, The University of Melbourne, and Douglass S Rovinsky, Associate Research Scientist, School of Biological Sciences, Monash University

This article is republished from The Conversation under a Creative Commons license. Read the original article.

Careel Head Road Shops and the Bangalley- Burrowong Creeks: Some History 
Careel Bay Marina Environs November 2024 - Spring Celebrations
Careel Bay Playing Fields History and Current
Careel Bay Steamer Wharf + Boatshed: some history 
Careel Creek 
Careel Creek - If you rebuild it they will come
Church Point Public Wharf - 1885 to 2025: Some History 
Clareville Beach
Clareville/Long Beach Reserve + some History
Clareville Public Wharf: 1885 to 1935 - Some History 
Coastal Stability Series: Cabbage Tree Bay To Barrenjoey To Observation Point by John Illingsworth, Pittwater Pathways, and Dr. Peter Mitchell OAM
Community Concerned Over the Increase of Plastic Products Being Used by the Northern Beaches Council for Installations in Pittwater's Environment
Cowan Track by Kevin Murray
Crown Reserves Improvement Fund Allocations 2021
Crown Reserves Improvement Fund 2022-23: $378,072 Allocated To Council For Weed Control - Governor Phillip Park Gets a Grant This Time: full details of all 11 sites
Crown Reserves Improvement Fund Allocations 2023-2024
Crown Reserves Grants 2025 Announced: Local focus on Weeds + Repairs to Long Reef Boardwalk + some pictures of council's recent works at Hitchcock Park - Careel Bay playing fields - CRIF 2025
Curl Curl To Freshwater Walk: October 2021 by Kevin Murray and Joe Mills
Currawong and Palm Beach Views - Winter 2018
Currawong-Mackerel-The Basin A Stroll In Early November 2021 - photos by Selena Griffith
Currawong State Park Currawong Beach +  Currawong Creek
Deep Creek To Warriewood Walk photos by Joe Mills
Microplastic assessment report 2026: Dee Why Lagoon Among Most Polluted in New South Wales - 56.55% of Manly Lagoon's plastic pollution is Artificial Turf - Pittwater Least Polluted
Milton Family Property History - Palm Beach By William (Bill) James Goddard II with photos courtesy of the Milton Family   - Snapperman to Sandy Point, Pittwater
Mona Vale Beach - A Stroll Along, Spring 2021 by Kevin Murray
Mona Vale Headland, Basin and Beach Restoration
Mona Vale Woolworths Front Entrance Gets Garden Upgrade: A Few Notes On The Site's History 
Mother Brushtail Killed On Barrenjoey Road: Baby Cried All Night - Powerful Owl Struck At Same Time At Careel Bay During Owlet Fledgling Season: calls for mitigation measures - The List of what you can do for those who ask 'What You I Do' as requested
Mount Murray Anderson Walking Track by Kevin Murray and Joe Mills
Mullet Creek
Muogamarra Nature Reserve in Cowan celebrates 90 years: a few insights into The Vision of John Duncan Tipper, Founder 
Muogamarra by Dr Peter Mitchell OAM and John Illingsworth
Narrabeen Creek
Narrabeen Lagoon Catchment: Past Notes Present Photos by Margaret Woods
Narrabeen Lagoon Entrance Clearing Works: September To October 2023  pictures by Joe Mills
North Narrabeen in 1911 - Panoramas taken for West's Lakeside Estate 
Out and About July 2020 - Storm swell
Out & About: July 2024 - Barrenjoey To Paradise Beach To Bayview To Narrabeen + Middle Creek - by John Illingsworth, Adriaan van der Wallen, Joe Mills, Suzanne Daly, Jacqui Marlowe and AJG
Palm Beach Headland Becomes Australia’s First Urban Night Sky Place: Barrenjoey High School Alumni Marnie Ogg's Hard Work
Palm Beach Public Wharf: Some History 
Paradise Beach Baths renewal Complete - Taylor's Point Public Wharf Rebuild Underway
Realises Long-Held Dream For Everyone
Paradise Beach Wharf + Taylor's Wharf renewal projects: October 2024 pictorial update - update pics of Paradise Wharf and Pool renewal, pre-renewal Taylors Point wharf + a few others of Pittwater on a Spring Saturday afternoon
Pictures From The Past: Views Of Early Narrabeen Bridges - 1860 To 1966
Pittwater Beach Reserves Have Been Dedicated For Public Use Since 1887 - No 1.: Avalon Beach Reserve- Bequeathed By John Therry 
Pittwater Reserves: The Green Ways; Bungan Beach and Bungan Head Reserves:  A Headland Garden 
Pittwater Reserves, The Green Ways: Clareville Wharf and Taylor's Point Jetty
Pittwater Reserves: The Green Ways; Hordern, Wilshire Parks, McKay Reserve: From Beach to Estuary 
Pittwater Reserves - The Green Ways: Mona Vale's Village Greens a Map of the Historic Crown Lands Ethos Realised in The Village, Kitchener and Beeby Parks 
Pittwater Reserves: The Green Ways Bilgola Beach - The Cabbage Tree Gardens and Camping Grounds - Includes Bilgola - The Story Of A Politician, A Pilot and An Epicure by Tony Dawson and Anne Spencer  
Pittwater spring: waterbirds return to Wetlands
Pittwater's Koalas Driven to Extinction: Some History
Pittwater's Lone Rangers - 120 Years of Ku-Ring-Gai Chase and the Men of Flowers Inspired by Eccleston Du Faur 
Pittwater's Great Outdoors: Spotted To The North, South, East + West- June 2023:  Palm Beach Boat House rebuild going well - First day of Winter Rainbow over Turimetta - what's Blooming in the bush? + more by Joe Mills, Selena Griffith and Pittwater Online
Threatened Species Day 2025 + A few insights into Pittwater's Past + Present Threatened Species 
$378,072 Allocated To Council For Weed Control: Governor Phillip Park Gets a Grant This Time: full details of all 11 sites - Crown Reserves Improvement Fund (CRIF) March 2023
Topham Track Ku-Ring-Gai Chase NP,  August 2022 by Joe Mills and Kevin Murray
Towlers Bay Walking Track by Joe Mills
Trafalgar Square, Newport: A 'Commons' Park Dedicated By Private Landholders - The Green Heart Of This Community
Tranquil Turimetta Beach, April 2022 by Joe Mills
Tree Management Policy Passed
Trial to remove shark nets - NBC - Central Coast - Waverly approached to nominate a beach each
Turimetta Beach Reserve by Joe Mills, Bea Pierce and Lesley
Turimetta Beach Reserve: Old & New Images (by Kevin Murray) + Some History
Turimetta Headland
Turimetta Moods by Joe Mills: June 2023
Turimetta Moods (Week Ending June 23 2023) by Joe Mills
Turimetta Moods: June To July 2023 Pictures by Joe Mills
Turimetta Moods: July Becomes August 2023 by Joe Mills
Turimetta Moods: August Becomes September 2023 ; North Narrabeen - Turimetta - Warriewood - Mona Vale photographs by Joe Mills
Turimetta Moods August 2025 by Joe Mills
Turimetta Moods: Mid-September To Mid-October 2023 by Joe Mills
Turimetta Moods: Late Spring Becomes Summer 2023-2024 by Joe Mills
Turimetta Moods: Warriewood Wetlands Perimeter Walk October 2024 by Joe Mills
Turimetta Moods: November 2024 by Joe Mills

Pittwater's Birds

Attracting Insectivore Birds to Your Garden: DIY Natural Tick Control small bird insectivores, species like the Silvereye, Spotted Pardalote, Gerygone, Fairywren and Thornbill, feed on ticks. Attracting these birds back into your garden will provide not only a residence for tick eaters but also the delightful moments watching these tiny birds provides.
Aussie Backyard Bird Count 2017: Take part from 23 - 29 October - how many birds live here?
Aussie Backyard Bird Count 2018 - Our Annual 'What Bird Is That?' Week Is Here! This week the annual Aussie Backyard Bird Count runs from 22-28 October 2018. Pittwater is one of those places fortunate to have birds that thrive because of an Aquatic environment, a tall treed Bush environment and areas set aside for those that dwell closer to the ground, in a sand, scrub or earth environment. To take part all you need is 20 minutes and your favourite outdoor space. Head to the website and register as a Counter today! And if you're a teacher, check out BirdLife Australia's Bird Count curriculum-based lesson plans to get your students (or the whole school!) involved

Australian Predators of the Sky by Penny Olsen - published by National Library of Australia

Australian Raven  Australian Wood Duck Family at Newport

A Week In Pittwater Issue 128   A Week In Pittwater - June 2014 Issue 168

Baby Birds Spring 2015 - Rainbow Lorikeets in our Yard - for Children 

Baby Birds by Lynleigh Greig, Southern Cross Wildlife Care - what do if being chased by a nesting magpie or if you find a baby bird on the ground

Baby Kookaburras in our Backyard: Aussie Bird Count 2016 - October

Balloons Are The Number 1 Marine Debris Risk Of Mortality For Our Seabirds - Feb 2019 Study

Bangalley Mid-Winter   Barrenjoey Birds Bird Antics This Week: December 2016

Bird of the Month February 2019 by Michael Mannington

Birdland Above the Estuary - October 2012  Birds At Our Window   Birds at our Window - Winter 2014  Birdland June 2016

Birdsong Is a Lovesong at This time of The Year - Brown Falcon, Little Wattle Bird, Australian Pied cormorant, Mangrove or Striated Heron, Great Egret, Grey Butcherbird, White-faced Heron 

Bird Songs – poems about our birds by youngsters from yesterdays - for children Bird Week 2015: 19-25 October

Bird Songs For Spring 2016 For Children by Joanne Seve

Birds at Careel Creek this Week - November 2017: includes Bird Count 2017 for Local Birds - BirdLife Australia by postcode

Black Cockatoo photographed in the Narrabeen Catchment Reserves this week by Margaret G Woods - July 2019

Black-Necked Stork, Mycteria Australis, Now Endangered In NSW, Once Visited Pittwater: Breeding Pair shot in 1855

Black Swans on Narrabeen Lagoon - April 2013   Black Swans Pictorial

Blue-faced Honeyeaters Breeding In Pittwater

Brush Turkeys In Suburbia: There's An App For That - Citizen Scientists Called On To Spot Brush Turkeys In Their Backyards
Buff-banded Rail spotted at Careel Creek 22.12.2012: a breeding pair and a fluffy black chick

Cayley & Son - The life and Art of Neville Henry Cayley & Neville William Cayley by Penny Olsen - great new book on the art works on birds of these Australian gentlemen and a few insights from the author herself
Crimson Rosella - + Historical Articles on

Death By 775 Cuts: How Conservation Law Is Failing The Black-Throated Finch - new study 'How to Send a Finch Extinct' now published

Eastern Rosella - and a little more about our progression to protecting our birds instead of exporting them or decimating them.

Endangered Little Tern Fishing at Mona Vale Beach

‘Feather Map of Australia’: Citizen scientists can support the future of Australia's wetland birds: for Birdwatchers, school students and everyone who loves our estuarine and lagoon and wetland birds

First Week of Spring 2014

Fledging - Baby Birds coming to ground: Please try and Keep them close to Parent Birds - Please Put out shallow dishes of water in hot weather

Fledgling Common Koel Adopted by Red Wattlebird -Summer Bird fest 2013  Flegdlings of Summer - January 2012

Flocks of Colour by Penny Olsen - beautiful new Bird Book Celebrates the 'Land of the Parrots'

Friendly Goose at Palm Beach Wharf - Pittwater's Own Mother Goose

Front Page Issue 177  Front Page Issue 185 Front Page Issue 193 - Discarded Fishing Tackle killing shorebirds Front Page Issue 203 - Juvenile Brush Turkey  Front Page Issue 208 - Lyrebird by Marita Macrae Front Page Issue 219  Superb Fairy Wren Female  Front Page Issue 234National Bird Week October 19-25  and the 2015 the Aussie Back Yard Bird Count: Australia's First Bird Counts - a 115 Year Legacy - with a small insight into our first zoos Front Page Issue 236: Bird Week 2015 Front Page Issue 244: watebirds Front Page Issue 260: White-face Heron at Careel Creek Front Page Issue 283: Pittwater + more birds for Bird Week/Aussie Bird Count  Front Page Issue 284: Pittwater + more birds for Bird Week/Aussie Bird Count Front Page Issue 285: Bird Week 2016  Front Page Issue 331: Spring Visitor Birds Return

G . E. Archer Russell (1881-1960) and His Passion For Avifauna From Narrabeen To Newport 

Glossy Black-Cockatoo Returns To Pittwater by Paul Wheeler Glossy Cockatoos - 6 spotted at Careel Bay February 2018

Grey Butcher Birds of Pittwater

Harry Wolstenholme (June 21, 1868 - October 14, 1930) Ornithologist Of Palm Beach, Bird Man Of Wahroonga 

INGLESIDE LAND RELEASE ON AGAIN BUT MANY CHALLENGES  AHEAD by David Palmer

Issue 60 May 2012 Birdland - Smiles- Beamings -Early -Winter - Blooms

Jayden Walsh’s Northern Beaches Big Year - courtesy Pittwater Natural Heritage Association

John Gould's Extinct and Endangered Mammals of Australia  by Dr. Fred Ford - Between 1850 and 1950 as many mammals disappeared from the Australian continent as had disappeared from the rest of the world between 1600 and 2000! Zoologist Fred Ford provides fascinating, and often poignant, stories of European attitudes and behaviour towards Australia's native fauna and connects these to the animal's fate today in this beautiful new book - our interview with the author

July 2012 Pittwater Environment Snippets; Birds, Sea and Flowerings

Juvenile Sea Eagle at Church Point - for children

King Parrots in Our Front Yard  

Kookaburra Turf Kookaburra Fledglings Summer 2013  Kookaburra Nesting Season by Ray Chappelow  Kookaburra Nest – Babies at 1.5 and 2.5 weeks old by Ray Chappelow  Kookaburra Nest – Babies at 3 and 4 weeks old by Ray Chappelow  Kookaburra Nest – Babies at 5 weeks old by Ray Chappelow Kookaburra and Pittwater Fledglings February 2020 to April 2020

Lion Island's Little Penguins (Fairy Penguins) Get Fireproof Homes - thanks to NSW National Parks and Wildlife Service and the Fix it Sisters Shed

Long-Billed Corella

Lorikeet - Summer 2015 Nectar

Lyre Bird Sings in Local National Park - Flock of Black Cockatoos spotted - June 2019

Magpie's Melodic Melodies - For Children (includes 'The Magpie's Song' by F S Williamson)

Masked Lapwing (Plover) - Reflected

May 2012 Birdland Smiles Beamings Early Winter Blooms 

Mistletoebird At Bayview

Musk Lorikeets In Pittwater: Pittwater Spotted Gum Flower Feast - May 2020

Nankeen Kestrel Feasting at Newport: May 2016

National Bird Week 2014 - Get Involved in the Aussie Backyard Bird Count: National Bird Week 2014 will take place between Monday 20 October and Sunday 26 October, 2014. BirdLife Australia and the Birds in Backyards team have come together to launch this year’s national Bird Week event the Aussie Backyard Bird Count! This is one the whole family can do together and become citizen scientists...

National Bird Week October 19-25  and the 2015 the Aussie Back Yard Bird Count: Australia's First Bird Counts - a 115 Year Legacy - with a small insight into our first zoos

Native Duck Hunting Season Opens in Tasmania and Victoria March 2018: hundreds of thousands of endangered birds being killed - 'legally'!

Nature 2015 Review Earth Air Water Stone

New Family of Barking Owls Seen in Bayview - Church Point by Pittwater Council

Noisy Visitors by Marita Macrae of PNHA 

Pittwater Becalmed  Pittwater Birds in Careel Creek Spring 2018   Pittwater Waterbirds Spring 2011  Pittwater Waterbirds - A Celebration for World Oceans Day 2015

Pittwater's Little Penguin Colony: The Saving of the Fairies of Lion Island Commenced 65 Years Ago this Year - 2019

Pittwater's Mother Nature for Mother's Day 2019

Pittwater's Waterhens: Some Notes - Narrabeen Creek Bird Gathering: Curious Juvenile Swamp Hen On Warriewood Boardwalk + Dusky Moorhens + Buff Banded Rails In Careel Creek

Plastic in 99 percent of seabirds by 2050 by CSIRO

Plover Appreciation Day September 16th 2015

Powerful and Precious by Lynleigh Grieg

Red Wattlebird Song - November 2012

Restoring The Diamond: every single drop. A Reason to Keep Dogs and Cats in at Night. 

Return Of Australasian Figbird Pair: A Reason To Keep The Trees - Aussie Bird Count 2023 (16–22 October) You can get involved here: aussiebirdcount.org.au

Salt Air Creatures Feb.2013

Scaly-breasted Lorikeet

Sea Birds off the Pittwater Coast: Albatross, Gannet, Skau + Australian Poets 1849, 1898 and 1930, 1932

Sea Eagle Juvenile at Church Point

Seagulls at Narrabeen Lagoon

Seen but Not Heard: Lilian Medland's Birds - Christobel Mattingley - one of Australia's premier Ornithological illustrators was a Queenscliff lady - 53 of her previously unpublished works have now been made available through the auspices of the National Library of Australia in a beautiful new book

7 Little Ducklings: Just Keep Paddling - Australian Wood Duck family take over local pool by Peta Wise 

Shag on a North Avalon Rock -  Seabirds for World Oceans Day 2012

Short-tailed Shearwaters Spring Migration 2013 

South-West North-East Issue 176 Pictorial

Spring 2012 - Birds are Splashing - Bees are Buzzing

Spring Becomes Summer 2014- Royal Spoonbill Pair at Careel Creek

Spring Notes 2018 - Royal Spoonbill in Careel Creek

Station Beach Off Leash Dog Area Proposal Ignores Current Uses Of Area, Environment, Long-Term Fauna Residents, Lack Of Safe Parking and Clearly Stated Intentions Of Proponents have your say until February 28, 2019

Summer 2013 BirdFest - Brown Thornbill  Summer 2013 BirdFest- Canoodlers and getting Wet to Cool off  Summer 2013 Bird Fest - Little Black Cormorant   Summer 2013 BirdFest - Magpie Lark

Summer BirdFest 2026: Play antics of New Locals - Blue-faced Honeyeaters Breeding In Pittwater

The Mopoke or Tawny Frogmouth – For Children - A little bit about these birds, an Australian Mopoke Fairy Story from 91 years ago, some poems and more - photo by Adrian Boddy
Winter Bird Party by Joanne Seve

New Shorebirds WingThing  For Youngsters Available To Download

A Shorebirds WingThing educational brochure for kids (A5) helps children learn about shorebirds, their life and journey. The 2021 revised brochure version was published in February 2021 and is available now. You can download a file copy here.

If you would like a free print copy of this brochure, please send a self-addressed envelope with A$1.10 postage (or larger if you would like it unfolded) affixed to: BirdLife Australia, Shorebird WingThing Request, 2-05Shorebird WingThing/60 Leicester St, Carlton VIC 3053.


Shorebird Identification Booklet

The Migratory Shorebird Program has just released the third edition of its hugely popular Shorebird Identification Booklet. The team has thoroughly revised and updated this pocket-sized companion for all shorebird counters and interested birders, with lots of useful information on our most common shorebirds, key identification features, sighting distribution maps and short articles on some of BirdLife’s shorebird activities. 

The booklet can be downloaded here in PDF file format: http://www.birdlife.org.au/documents/Shorebird_ID_Booklet_V3.pdf

Paper copies can be ordered as well, see http://www.birdlife.org.au/projects/shorebirds-2020/counter-resources for details.

Download BirdLife Australia's children’s education kit to help them learn more about our wading birdlife

Shorebirds are a group of wading birds that can be found feeding on swamps, tidal mudflats, estuaries, beaches and open country. For many people, shorebirds are just those brown birds feeding a long way out on the mud but they are actually a remarkably diverse collection of birds including stilts, sandpipers, snipe, curlews, godwits, plovers and oystercatchers. Each species is superbly adapted to suit its preferred habitat.  The Red-necked Stint is as small as a sparrow, with relatively short legs and bill that it pecks food from the surface of the mud with, whereas the Eastern Curlew is over two feet long with a exceptionally long legs and a massively curved beak that it thrusts deep down into the mud to pull out crabs, worms and other creatures hidden below the surface.

Some shorebirds are fairly drab in plumage, especially when they are visiting Australia in their non-breeding season, but when they migrate to their Arctic nesting grounds, they develop a vibrant flush of bright colours to attract a mate. We have 37 types of shorebirds that annually migrate to Australia on some of the most lengthy and arduous journeys in the animal kingdom, but there are also 18 shorebirds that call Australia home all year round.

What all our shorebirds have in common—be they large or small, seasoned traveller or homebody, brightly coloured or in muted tones—is that each species needs adequate safe areas where they can successfully feed and breed.

The National Shorebird Monitoring Program is managed and supported by BirdLife Australia. 

This project is supported by Glenelg Hopkins Catchment Management Authority and Hunter Local Land Services through funding from the Australian Government’s National Landcare Program. Funding from Helen Macpherson Smith Trust and Port Phillip Bay Fund is acknowledged. 

The National Shorebird Monitoring Program is made possible with the help of over 1,600 volunteers working in coastal and inland habitats all over Australia. 

The National Shorebird Monitoring program (started as the Shorebirds 2020 project initiated to re-invigorate monitoring around Australia) is raising awareness of how incredible shorebirds are, and actively engaging the community to participate in gathering information needed to conserve shorebirds. 

In the short term, the destruction of tidal ecosystems will need to be stopped, and our program is designed to strengthen the case for protecting these important habitats. 

In the long term, there will be a need to mitigate against the likely effects of climate change on a species that travels across the entire range of latitudes where impacts are likely. 

The identification and protection of critical areas for shorebirds will need to continue in order to guard against the potential threats associated with habitats in close proximity to nearly half the human population. 

Here in Australia, the place where these birds grow up and spend most of their lives, continued monitoring is necessary to inform the best management practice to maintain shorebird populations. 

BirdLife Australia believe that we can help secure a brighter future for these remarkable birds by educating stakeholders, gathering information on how and why shorebird populations are changing, and working to grow the community of people who care about shorebirds.

To find out more visit: http://www.birdlife.org.au/projects/shorebirds-2020/shorebirds-2020-program

Surfers for Climate

A sea-roots movement dedicated to mobilising and empowering surfers for continuous and positive climate action.

Surfers for Climate are coming together in lineups around the world to be the change we want to see.

With roughly 35 million surfers across the globe, our united tribe has a powerful voice. 

Add yours to the conversation by signing up here.

Surfers for Climate will keep you informed, involved and active on both the local and global issues and solutions around the climate crisis via our allies hub. 

Help us prevent our favourite spots from becoming fading stories of waves we used to surf.

Together we can protect our oceans and keep them thriving for future generations to create lifelong memories of their own.

Visit:  http://www.surfersforclimate.org.au/

Create a Habitat Stepping Stone!

Over 50 Pittwater households have already pledged to make a difference for our local wildlife, and you can too! Create a habitat stepping stone to help our wildlife out. It’s easy - just add a few beautiful habitat elements to your backyard or balcony to create a valuable wildlife-friendly stopover.

How it works

1) Discover: Visit the website below to find dozens of beautiful plants, nest boxes and water elements you can add to your backyard or balcony to help our local wildlife.

2) Pledge: Select three or more elements to add to your place. You can even show you care by choosing to have a bird appear on our online map.

3) Share: Join the Habitat Stepping Stones Facebook community to find out what’s happening in the natural world, and share your pics, tips and stories.

What you get                                  

• Enjoy the wonders of nature, right outside your window. • Free and discounted plants for your garden. • A Habitat Stepping Stone plaque for your front fence. • Local wildlife news and tips. • Become part of the Pittwater Habitat Stepping Stones community.

Get the kids involved and excited about helping out! www.HabitatSteppingStones.org.au

No computer? No problem -Just write to the address below and we’ll mail you everything you need. Habitat Stepping Stones, Department of Environmental Sciences, Macquarie University NSW 2109. This project is assisted by the NSW Government through its Environmental Trust

Newport Community Gardens

Anyone interested in joining our community garden group please feel free to come and visit us on Sunday at 10am at the Woolcott Reserve in Newport!


Keep in Touch with what's happening on Newport Garden's Facebook: https://www.facebook.com/newportcg/

Avalon Preservation Association


The Avalon Preservation Association, also known as Avalon Preservation Trust. We are a not for profit volunteer community group incorporated under the NSW Associations Act, established 50 years ago. We are committed to protecting your interests – to keeping guard over our natural and built environment throughout the Avalon area.


Membership of the association is open to all those residents and/or ratepayers of Avalon Beach and adjacent areas who support the aims and objectives of our Association.

Report illegal dumping

NSW Government

The RIDonline website lets you report the types of waste being dumped and its GPS location. Photos of the waste can also be added to the report.

The Environment Protection Authority (EPA), councils and Regional Illegal Dumping (RID) squads will use this information to investigate and, if appropriate, issue a fine or clean-up notice. Penalties for illegal dumping can be up to $15,000 and potential jail time for anybody caught illegally dumping within five years of a prior illegal dumping conviction.

The Green Team

Profile
This Youth-run, volunteer-based environment initiative has been attracting high praise from the founders of Living Ocean as much as other local environment groups recently. 
Creating Beach Cleans events, starting their own, sustainability days - ‘action speaks louder than words’ ethos is at the core of this group. 

Australian Native Foods website: http://www.anfil.org.au/

Wildlife Carers and Organisations in Pittwater:

Sydney Wildlife rescues, rehabilitates and releases sick, injured and orphaned native wildlife. From penguins, to possums and parrots, native wildlife of all descriptions passes through the caring hands of Sydney Wildlife rescuers and carers on a daily basis. We provide a genuine 24 hour, 7 day per week emergency advice, rescue and care service.

As well as caring for sick, injured and orphaned native wildlife, Sydney Wildlife is also involved in educating the community about native wildlife and its habitat. We provide educational talks to a wide range of groups and audiences including kindergartens, scouts, guides, a wide range of special interest groups and retirement villages. Talks are tailored to meet the needs and requirements of each group. 

Profile

Found an injured native animal? We're here to help.

Keep the animal contained, warm, quiet and undisturbed. Do not offer any food or water. Call Sydney Wildlife immediately on 9413 4300, or take the animal to your nearest vet. Generally there is no charge. Find out more at: www.sydneywildlife.org.au

Southern Cross Wildlife Care was launched over 6 years ago. It is the brainchild of Dr Howard Ralph, the founder and chief veterinarian. SCWC was established solely for the purpose of treating injured, sick and orphaned wildlife. No wild creature in need that passes through our doors is ever rejected. 

Profile

People can assist SCWC by volunteering their skills ie: veterinary; medical; experienced wildlife carers; fundraising; "IT" skills; media; admin; website etc. We are always having to address the issue of finances as we are a non commercial veterinary service for wildlife in need, who obviously don't have cheque books in their pouches. It is a constant concern and struggle of ours when we are pre-occupied with the care and treatment of the escalating amount of wildlife that we have to deal with. Just becoming a member of SCWC for $45 a year would be a great help. Regular monthly donations however small, would be a wonderful gift and we could plan ahead knowing that we had x amount of funds that we could count on. Our small team of volunteers are all unpaid even our amazing vet Howard, so all funds raised go directly towards our precious wildlife. SCWC is TAX DEDUCTIBLE.

Find out more at: southerncrosswildlifecare.org.au/wp/

Avalon Community Garden

Community Gardens bring people together and enrich communities. They build a sense of place and shared connection.

Profile

Avalon Community Garden is a community led initiative to create accessible food gardens in public places throughout the Pittwater area. Our aim is to share skills and knowledge in creating fabulous local, organic food. But it's not just about great food. We also aim to foster community connection, stimulate creative ideas for community resilience and celebrate our abundance. Open to all ages and skills, our first garden is on the grounds of Barrenjoey High School (off Tasman Road)Become part of this exciting initiative to change the world locally. 

Avalon Community Garden
2 Tasman Road
North Avalon

Newport Community Garden: Working Bee Second Sunday of the month

Newport Community Gardens Inc. is a not for profit incorporated association. The garden is in Woolcott Reserve.

Objectives
Local Northern Beaches residents creating sustainable gardens in public spaces
Strengthening the local community, improving health and reconnecting with nature
To establish ecologically sustainable gardens for the production of vegetables, herbs, fruit and companion plants within Pittwater area 
To enjoy and forge friendships through shared gardening.
Membership is open to all Community members willing to participate in establishing gardens and growing sustainable food.
Subscription based paid membership.
We meet at the garden between 9am – 12 noon
New members welcome

For enquiries contact newportcommunitygardenau@gmail.com

Living Ocean


Living Ocean was born in Whale Beach, on the Northern Beaches of Sydney, surrounded by water and set in an area of incredible beauty.

Living Ocean is a charity that promotes the awareness of human impact on the ocean, through research, education, creative activity in the community, and support of others who sustain ocean health and integrity.

And always celebrating and honouring the natural environment and the lifestyle that the ocean offers us.

Our whale research program builds on research that has been conducted off our coastline by our experts over many years and our Centre for Marine Studies enables students and others to become directly involved.

Through partnerships with individuals and organizations, we conceive, create and coordinate campaigns that educate all layers of our community – from our ‘No Plastic Please’ campaign, which is delivered in partnership with local schools, to film nights and lectures, aimed at the wider community.

Additionally, we raise funds for ocean-oriented conservation groups such as Sea Shepherd.

Donations are tax-deductable 
Permaculture Northern Beaches

Want to know where your food is coming from? 

Do you like to enrich the earth as much as benefit from it?

Find out more here:

Profile

What Does PNHA do?

PROFILE

About Pittwater Natural Heritage Association (PNHA)
With urbanisation, there are continuing pressures that threaten the beautiful natural environment of the Pittwater area. Some impacts are immediate and apparent, others are more gradual and less obvious. The Pittwater Natural Heritage Association has been formed to act to protect and preserve the Pittwater areas major and most valuable asset - its natural heritage. PNHA is an incorporated association seeking broad based community membership and support to enable it to have an effective and authoritative voice speaking out for the preservation of Pittwater's natural heritage. Please contact us for further information.

Our Aims
  • To raise public awareness of the conservation value of the natural heritage of the Pittwater area: its landforms, watercourses, soils and local native vegetation and fauna.
  • To raise public awareness of the threats to the long-term sustainability of Pittwater's natural heritage.
  • To foster individual and community responsibility for caring for this natural heritage.
  • To encourage Council and the NSW Government to adopt and implement policies and works which will conserve, sustain and enhance the natural heritage of Pittwater.
Act to Preserve and Protect!
If you would like to join us, please fill out the Membership Application Form ($20.00 annually - $10 concession)

Email: pnhainfo@gmail.com Or click on Logo to visit website.

Think before you print ; A kilo of recycled paper creates around 1.8 kilograms of carbon emissions, without taking into account the emissions produced from transporting the paper. So, before you send a document to print, think about how many kilograms of carbon emissions you could save by reading it on screen.

Friends Of Narrabeen Lagoon Catchment Activities

Bush Regeneration - Narrabeen Lagoon Catchment  
This is a wonderful way to become connected to nature and contribute to the health of the environment.  Over the weeks and months you can see positive changes as you give native species a better chance to thrive.  Wildlife appreciate the improvement in their habitat.

Belrose area - Thursday mornings 
Belrose area - Weekend mornings by arrangement
Contact: Phone or text Conny Harris on 0432 643 295

Wheeler Creek - Wednesday mornings 9-11am
Contact: Phone or text Judith Bennett on 0402 974 105
Or email: Friends of Narrabeen Lagoon Catchment : email@narrabeenlagoon.org.au

Pittwater's Environmental Foundation

Pittwater Environmental Foundation was established in 2006 to conserve and enhance the natural environment of the Pittwater local government area through the application of tax deductible donations, gifts and bequests. The Directors were appointed by Pittwater Council. 
 Profile

About 33% (about 1600 ha excluding National Parks) of the original pre-European bushland in Pittwater remains in a reasonably natural or undisturbed condition. Of this, only about 400ha remains in public ownership. All remaining natural bushland is subject to encroachment, illegal clearing, weed invasion, feral animals, altered drainage, bushfire hazard reduction requirements and other edge effects. Within Pittwater 38 species of plants or animals are listed as endangered or threatened under the Threatened Species Act. There are two endangered populations (Koala and Squirrel Glider) and eight endangered ecological communities or types of bushland. To visit their site please click on logo above.

Avalon Boomerang Bags


Avalon Boomerang Bags was introduced to us by Surfrider Foundation and Living Ocean, they both helped organise with the support of Pittwater Council the Recreational room at Avalon Community Centre which we worked from each Tuesday. This is the Hub of what is a Community initiative to help free Avalon of single use plastic bags and to generally spread the word of the overuse of plastic. 

Find out more and get involved.

"I bind myself today to the power of Heaven, the light of the sun, the brightness of the moon, the splendour of fire, the flashing of lightning, the swiftness of wind, the depth of the sea, the stability of the earth, the compactness of rocks." -  from the Prayer of Saint Patrick