Mapping microplastics in 120 NSW Estuaries
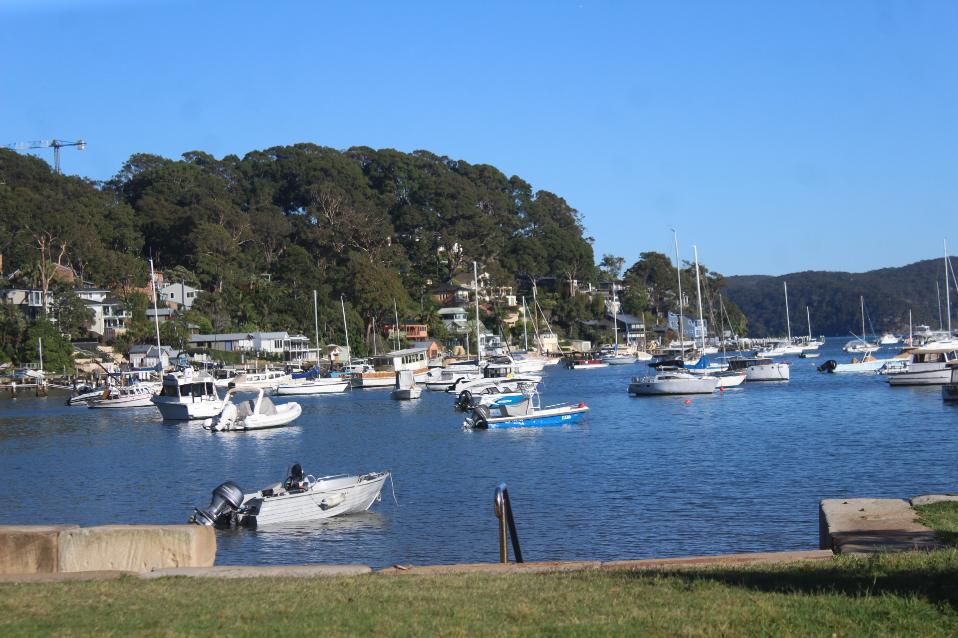
How much microplastic is in our local waterways?
Which estuaries have the highest levels of microplastic contamination? What are the main sources of microplastics in New South Wales?
These are the questions DCCEEW researchers are determined to answer as they undertake a broadscale microplastics survey of 120 NSW estuaries.
In 2022 the state-wide Marine Debris Threat and Risk Assessment identified microplastics as a priority threat to our waterways.
“Microplastics are an insidious problem, they are really hard to get out of the environment. We find them everywhere, in all corners of the world. They are in our bloodstream and in the food that we eat,” EPA Programs Manager, Rupert Saville said.
Sam Lynch, Coastal and Marine Scientist at DCCEEW, said the project aims to develop a deeper understanding of microplastics through a broad-scale state-wide assessment.
“Of the waterways we’ve assessed, 10% of those estuaries have what we call nurdles, also known as plastic feedstock, which is what plastic manufacturers use to develop plastic items,” she said.
Taking inspiration from nature, the team use a specially designed net trawled behind a boat or canoe.
“If you think about how a mantra ray or whale shark feeds, the net acts in a very similar way, capturing microplastics from the top 15 cm of the water surface,” Ms Lynch said.
The samples are taken back to the laboratory where plastic is extracted, dyed and photographed. A computer then analyses the photo to count microplastics and determines the pollution rating. Each polymer type is identified using a Fourier Transform Infrared Spectroscopy machine.
This process allows the team to understand the density of microplastic in each estuary.
“So, we can not only see where the estuaries most affected by microplastics are in the state, but also what are the most polluting microplastic items,” Ms Lynch said.
“In all our urban estuaries we are finding a lot of artificial grass. We are also finding a high percentage of polystyrene.”
Mr Saville said in addition to identifying density per location and type of plastic, in some cases the research will help trace it back to the source.
“It allows us to understand where they are coming from, which catchments, in some cases which Local Government Areas and in certain cases, which factories.”
“Then we’re able to work with our partners in ‘Operation Clean Sweep’, who then work with councils and industries to really target these items at the source and stop them escaping into the environment in the first place,” he said.
The results will provide detailed insights into microplastic pollution.
“By the end of 2025, we will be able to tell you what the density of microplastic is for the 120 waterways we assessed. There will be a grade for each estuary assessed of high, medium or low and there will be interactive heat maps for microplastic presence and abundance across the 120 estuaries surveyed,” Ms Lynch said.
For more information on the study’s methodology and the estuaries surveyed, visit the EPA website.
The study is undertaken by the Coastal and Marine Science team in the Department of Climate Change, Energy, the Environment and Water, funded by the NSW Environment Protection Authority.
It was designed to fill knowledge gaps around microplastics in NSW. A rapid microplastic assessment method was developed as part of the Marine Estate Management Strategy. This study sits under the Marine debris research and management program.
Background
The NSW Government is undertaking a Broadscale Microplastic Assessment (BMA) of 120 estuaries to provide a baseline dataset for surface water microplastic contamination.
The aim of this study is to:
- Highlight estuaries with the highest microplastic contamination levels
- Determine what items are contributing the most to microplastic contamination for NSW.
The NSW Marine Debris Threat and Risk Assessment identified microplastics as a high-priority threat item. Identifying microplastic items such as plastic resin pellets and polystyrene provides critical information to support evidence-based litter prevention programs and the NSW Plastics Action Plan. This gives us a better understanding of the source of microplastics to then prioritise management interventions and reduce the impacts. This data will identify estuaries and catchments to prioritise management efforts and will be used in the future for assessing management effectiveness.
The study is undertaken by the Coastal and Marine Science team in the Department of Climate Change, Energy, the Environment and Water (DCCEEW). To fill knowledge gaps around microplastics in NSW, the rapid microplastic assessment method was developed as part of the Marine Estate Management Strategy (MEMS). This method has been adopted for the BMA project, which is funded by the EPA.
This project has three major outputs:
- A state-wide baseline microplastic data set – which measures the microplastic density in 120 estuaries.
- Microplastic Pollution Grades – which are developed by comparatively assessing the microplastic density across NSW estuaries and rating them high, medium or low based on the number of microplastics.
- Microplastic identification – using the state-wide data set we are identifying each microplastic polymer type. This will enable government to prioritise those estuaries and microplastic types to be targeted for management and intervention.
Estuaries the study team are monitoring
- Avoca Lake
- Middle Harbour
- Batemans Bay
- Middle lagoon
- Bega River
- Minnamurra River
- Bellinger River
- Moona Moona Creek
- Belongil Creek
- Moonee Creek
- Bermagui River
- Moruya River
- Berowra Creek
- Muddy Creek
- Botany Bay
- Myall Broadwater
- Brisbane Water
- Myall Lake
- Broken Bay
- Myall River
- Brunswick River
- Nadgee Lake
- Burrill Lake
- Nadgee River
- Camden Haven River
- Nambucca River
- Cararma Creek
- Narrabeen Lagoon
- Cathie Creek
- North Creek
- Clarence River
- Nullica River
- Clyde River
- Oyster Channel
- Cockrone Lake
- Pambula River
- Coffs Creek
- Parramatta River
- Coila Lake
- Pipers Creek (Wallis Lake)
- Congo Creek
- Pittwater
- Conjola Lake
- Port Hacking
- Cooks River
- Port Jackson
- Coolongolook River
- Port Stephens
- Corindi River
- Richmond River
- Corunna Lake
- Saltwater Creek (Frederickton)
- Cowan Creek
- Sandon River
- Crooked River
- Shoalhaven River
- Cudgen Creek
- Smiths Lake
- Currambene Creek
- South West Rocks Creek
- Darkum Creek
- St Georges Basin
- Dee Why Lagoon
- Station Creek
- Duck River
- Swan Lake
- Durras Lake
- Tallow Creek
- Evans River
- Terranora Creek
- Fairy Creek
- Terrigal Lagoon
- Flat Top Point Creek
- Throsby Creek
- Georges River
- Tilba Tilba Lake
- Glenrock Lagoon
- Tilligery
- Haslams Creek
- Tomaga River
- Hastings River
- Toongabbie Creek
- Hawkesbury River Lower
- Towamba River
- Hawkesbury River Upper
- Towradgi Creek
- Hearns Lake
- Tuggerah Lake
- Hunter River
- Tuggerah Lakes/Budgewoi Lake
- Jervis Bay
- Tuggerah Lakes/Lake Munmorah
- Karuah River
- Tuross River
- Khappinghat Creek
- Tweed River
- Lake Ainsworth
- Twofold Bay
- Lake Arragagn
- Ulladulla
- Lake Illawarra
- Wagonga Inlet
- Lake Macquarie (North)
- Wallaga Lake
- Lake Macquarie (South)
- Wallagoot Lake
- Lake Mummuga
- Wallamba Cove
- Lane Cove River
- Wallamba River
- Macleay River
- Wallis Lake
- Manly Lagoon
- Wamberal Lagoon
- Manning River Lower
- Wapengo Lagoon
- Manning River Upper
- Wattamolla Creek
- Maria River
- Werri Lagoon
- Merimbula Lake
- Wonboyn River
- Meringo Creek
- Woolgoola Lake
- Merrica River
- Wooli River