Local Government Election Results Show Very High Informal Vote Rate
A new council formed through the forced amalgamation of the former Manly, Pittwater and Warringah Councils consists of roughly 59% of voters from Warringah, 26% from Pittwater and 15% from Manly.At the Local Government Elections held on Saturday September 9th the Informal Rate has averaged at 11.33%; pretty high, in fact, way above average across the board, the lowest percentage being in Manly, at 7% and the highest in the Curl Curl Ward where a staggering 12.8% either made a mistake or deliberately chose to snub these elections. Narrabeen and Pittwater also had a high ratio of Informal Voters, Narrabeen at 11.94% and Pittwater at 11.33%.
Informal votes fluctuate with 5% being the national average in any form of election in recent years. Past studies post-election have cited a presence of higher numbers of people from culturally diverse or voters from a non-English speaking background being the cause of Informal Votes. With almost 12% of 264 225 people either choosing to or involuntarily voting informally, well over 26 thousand residents have either turned their backs on this ‘brave new world’ and still refuse to acknowledge the council we had to have or the Ballot paper was a mystery to them.
There is clearly a great many, a silent majority, who have voted, well not voted really, with their feet/pen.
Figures for those who did not turn up to vote informally were unavailable as we went to press.
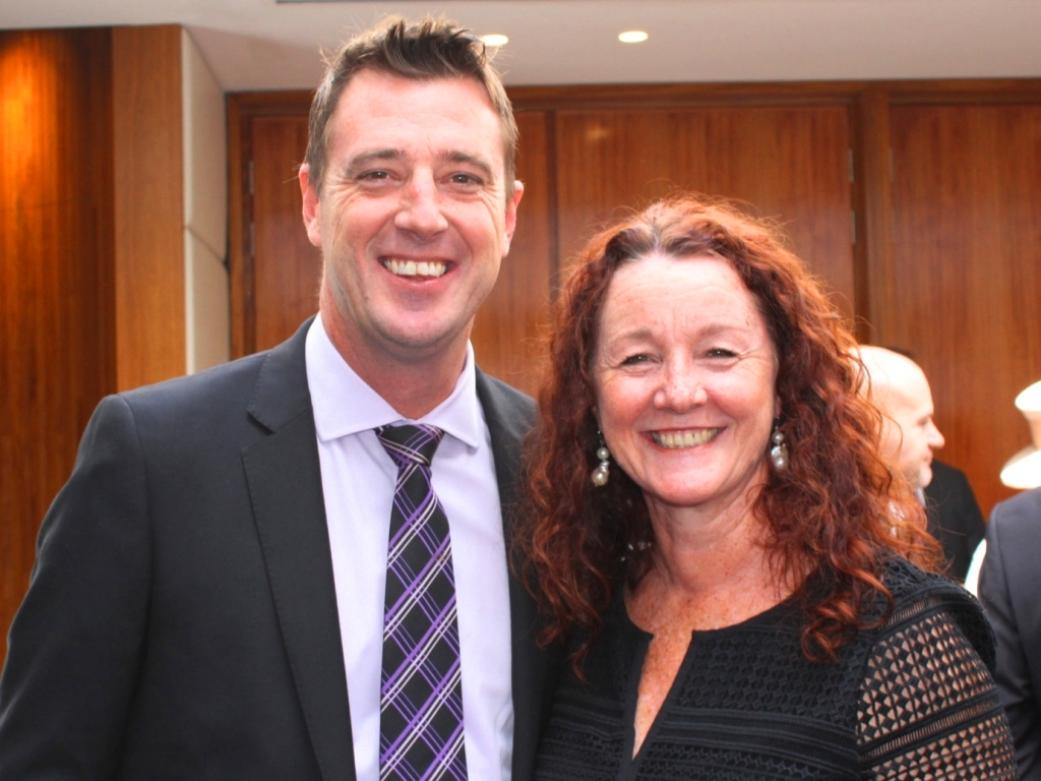
In Pittwater Alex McTaggart won the most votes solely for a candidate, gaining four times more than the next person, Kylie Ferguson, with Robert Hopton just a short way behind the former Deputy Mayor of Pittwater. The Liberals won the most votes overall with the Northern Beaches Independents topping the other votes.

Alex McTaggart - AJG Pic.
In Narrabeen Vincent DeLuca OAM won the most personal votes, followed by Conny Harris with the Liberals and the Northern Beaches Independents still outstripping all others.
What may rankle those still opposed to being ruled by any former Warringah guise is that the three councillors who voted against taking legal action to save Pittwater will now be their representatives once again, with the Liberals and Kylie Ferguson far outstripping any other Group, followed by Mr. Mc Taggart and then Ian White, now part of the Michael Regan led Northern Beaches Independents.
Despite a clear undercurrent of prevailing outrage in Pittwater of being forced to be reunited with Warringah, if 89% of residents really did want to retain Pittwater Council they either forgot yesterday or have been won over by familiar smiles - likewise for any disaffection with the Liberal Party.
The statistics available at midnight:
Council Party Totals
Party Votes %
Northern Beaches Independents 32890 31.4
Liberal 32201 30.8
Independent 15802 15.1
Labor 9466 9.0
The Greens 8930 8.5
Good For Manly 5413 5.2
CURL CURL WARD
Enrolment - 36,742, 3 Councillors to elect
21,978 formal votes (68.6% counted, 12.84% informal) 21 of 25 booths reporting.
FRENCHS FOREST WARD
Enrolment - 36,328, 3 Councillors to elect
23,888 formal votes (74.0% counted, 11.09% informal) 18 of 22 booths reporting.
MANLY WARD
Enrolment - 35,810, 3 Councillors to elect
19,131 formal votes (57.4% counted, 7.0% informal) 19 of 23 booths reporting.
NARRABEEN WARD
Enrolment - 36,283, 3 Councillors to elect
21,385 formal votes (66.9% counted, 11.94% informal) 24 of 28 booths reporting.
PITTWATER WARD
Enrolment - 36,815, 3 Councillors to elect
18,320 formal votes (56.1% counted, 11.33% informal) 17 of 21 booths reporting.
Pittwater Ward
results (as of 23.59 – 9/9/2017)
Summary of First Preference Votes
Group ATL/Candidate Group/Party/IND FP Votes Quota Ratio % Formal Votes
A Group Votes 2,890 0.63 15.78%
B Group Votes LIBERAL 5,395 1.18 29.45%
C Group Votes 1,996 0.44 10.90%
D Group Votes LABOR 870 0.19 4.75%
E Group Votes YOUR NORTHERN BEACHES INDEPENDENT TEAM 2,836 0.62 15.48%
F Group Votes THE GREENS 2,391 0.52 13.05%
G Group Votes 951 0.21 5.19%
H Group Votes 991 0.22 5.41%
Total Formal Votes Counted 18,320 100%
Total Informal/Other Votes 2,340 11.33%
Progressive Total Votes 20,660
Narrabeen Ward
results (as of 23.59 – 9/9/2017)
Group ATL/Candidate Group/Party/IND FP Votes Quota Ratio % Formal Votes
A Group Votes YOUR NORTHERN BEACHES INDEPENDENT TEAM 6,368 1.19 29.78%
B Group Votes 4,307 0.81 20.14%
C Group Votes LABOR 2,142 0.4 10.02%
D Group Votes LIBERAL 6,688 1.25 31.27%
E Group Votes 1,880 0.35 8.79%
Total Formal Votes Counted 21,385 100%
Total Informal/Other Votes 2,899 11.94%
Progressive Total Votes 24,284