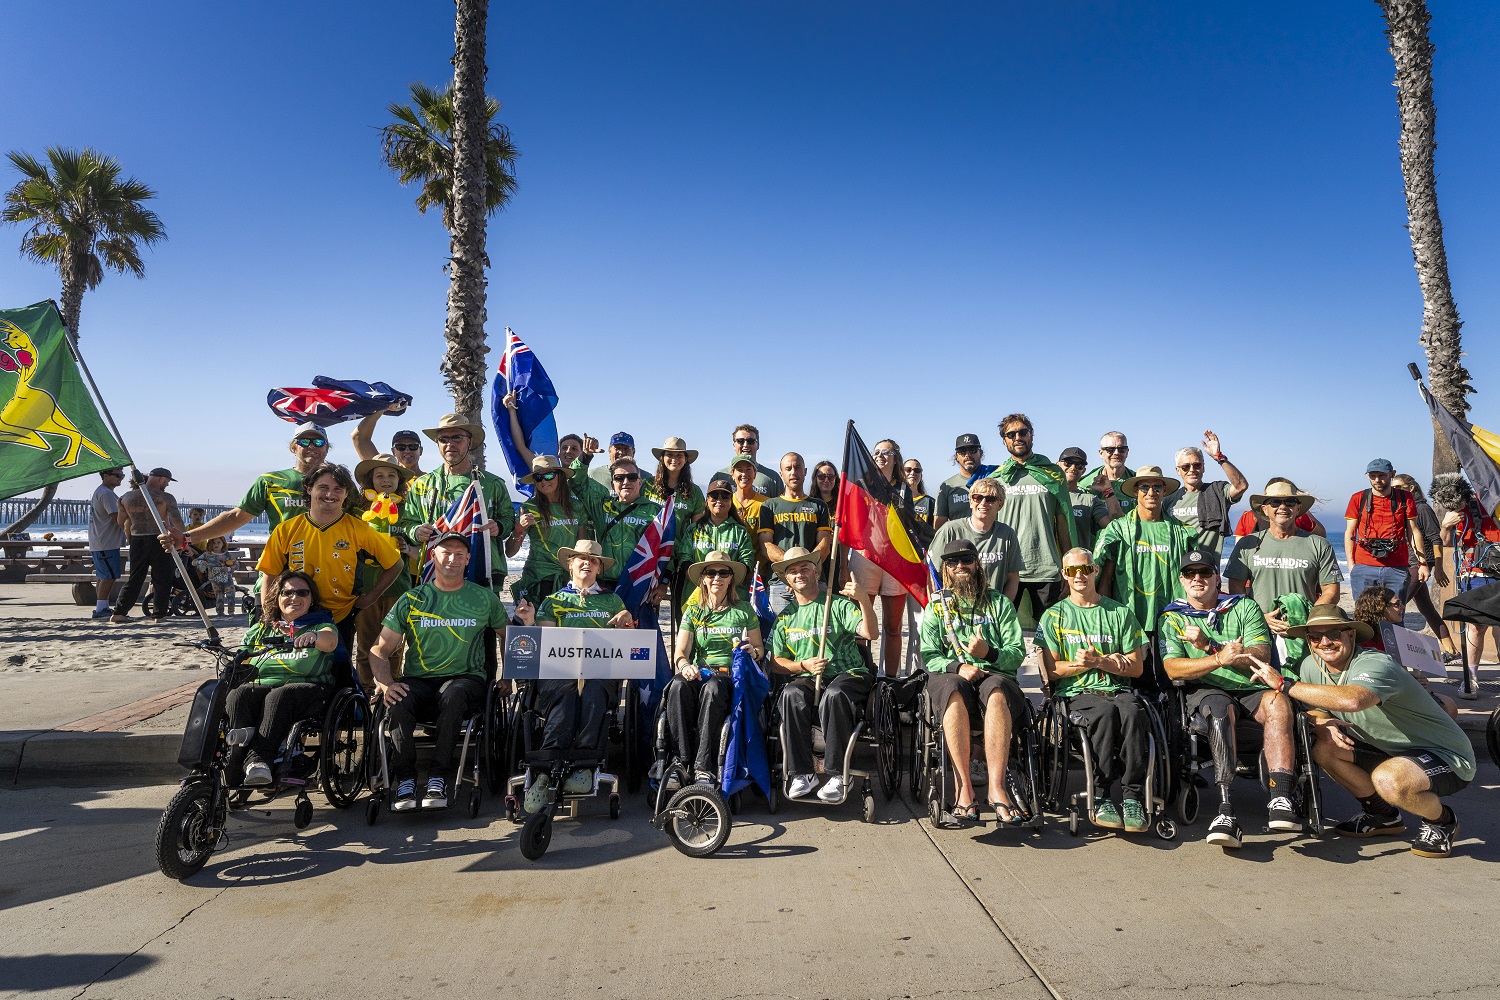
Team Australia at the 2025 Opening Ceremony. Credit: ISA /Sean Evans
Surfing Australia is proud to announce the 13 adaptive surfers selected to represent The Irukandjis, Australia's National Surfing Team, at the 2026 ISA World Para Surfing Championships!
Australia enters the 2026 campaign carrying strong momentum after an outstanding performance at the 2025 ISA World Para Surfing Championships, where the Irukandjis claimed Team Copper and secured eight individual medals across multiple divisions.
2026 ISA World Para Surfing Championships
The International Surfing Association (ISA) announced on July 24 2026 that the 2026 ISA World Para Surfing Championship (WPSC) will be held November 19-22, 2026 at DSRT Surf in Palm Desert, California.
The 11th edition of the event will be the first World Championship in ISA history to be held in a surf lagoon, providing a consistent, controlled environment for the world’s leading para surfers to showcase their performance and progression.
Home to the largest Wavegarden Cove-powered facility in North America, the 5.5 acre, 8.5-million-gallon DSRT Surf lagoon, developed by Beach Street Developers, can generate up to 1,000 waves per hour and features systems designed for sustainable, energy- and water-efficient operation.
With 140 athletes representing 24 national teams expected to compete across nine Para Surfing Sport Classes, the event will continue to showcase the discipline’s rapid growth as the ISA advances its long-term vision of para surfing’s inclusion in the Brisbane 2032 Paralympic Games.
DSRT Surf will welcome spectators to experience the competition in person and cheer on the world’s leading para surfers, while the ISA promotes a global live stream of the Championship on isasurf.org
Since the inaugural ISA World Para Surfing Championship in 2015, the sport has experienced a remarkable increase in participation, performance, and global reach. The ISA has continually refined the Para Surfing Classification System, maintaining alignment with IPC and Classification Code compliance, while supporting the growth of national and regional competitions throughout its worldwide membership.
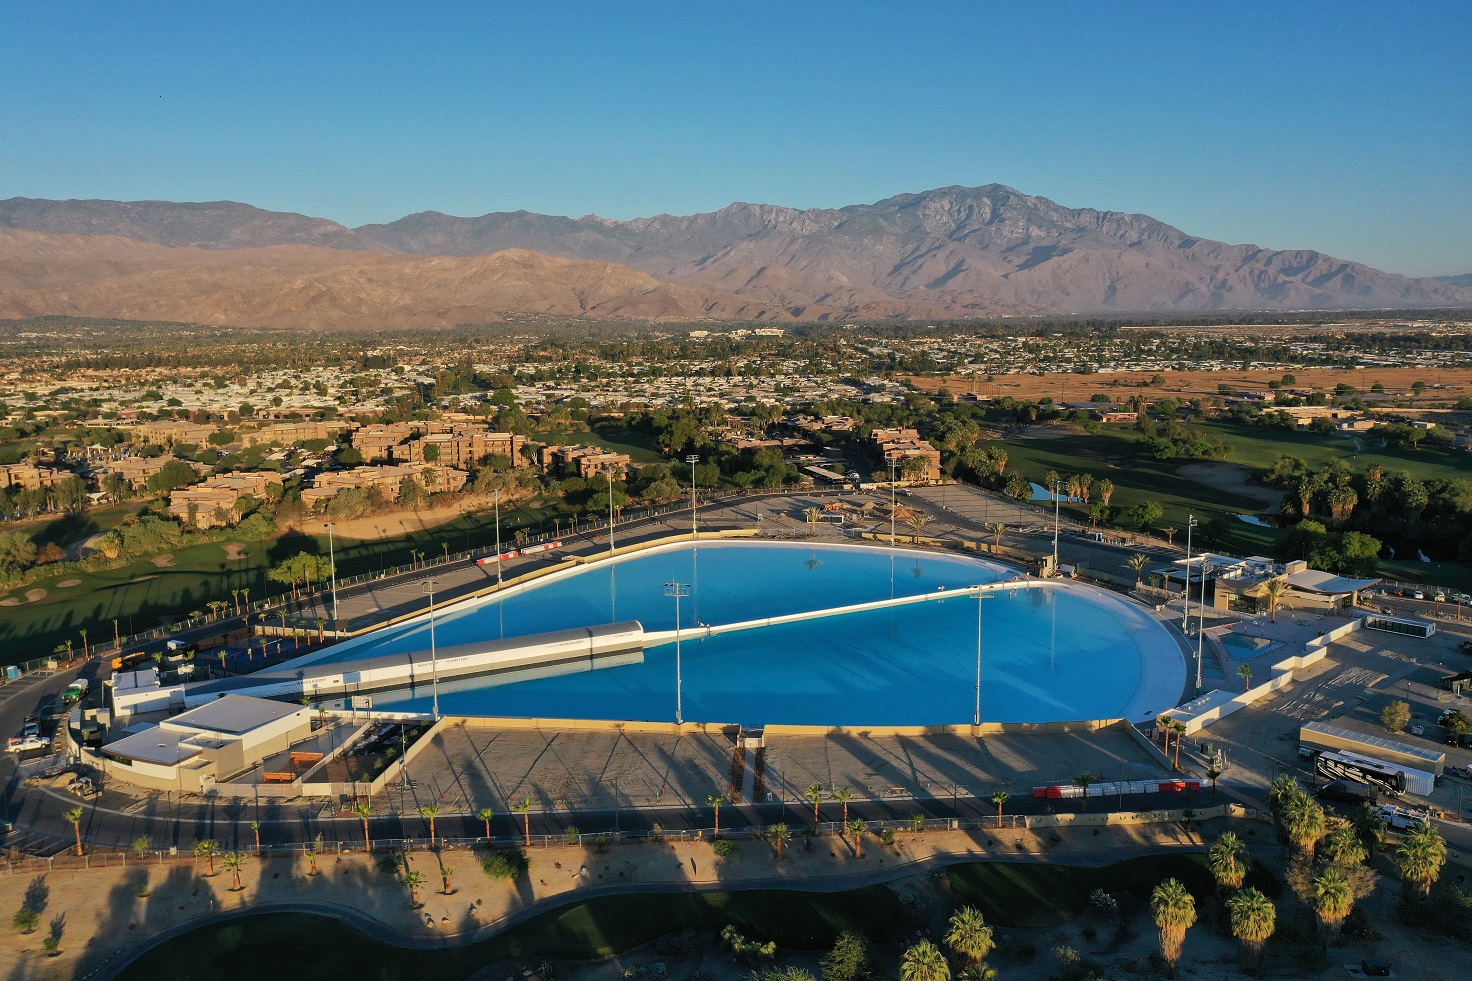
DSRT Surf in Palm Desert, California. Photo: DSRT Surf
ISA President Fernando Aguerre said:
“It’s incredible to see how every year, the WPSC has continued to raise the bar. We are proud to provide this platform that celebrates not only athletic excellence, but also inclusion and opportunity to experience surf lagoon technology in a high-performance environment. The consistency and high-performance nature of DSRT Surf will provide a unique opportunity for the world’s best para surfers to showcase their talent at the highest level. Our commitment to Paralympic inclusion remains stronger than ever. We continue to believe that Para Surfing belongs on the Paralympic stage, and every edition of this incredible event brings us another step closer to realizing that dream.”
John Luff, co-founder and managing partner of Beach Street Development said:
“From the beginning, we built DSRT Surf to expand what is possible in surfing, and we are proud to host this historic World Championship. Bringing the world’s leading para surfers together on consistent, world-class waves will create an exceptional platform for athletes to compete at their highest level, push the progression of the sport and showcase para surfing to a global audience. The ability to program and repeat wave conditions also creates greater consistency across the field and demonstrates how surf lagoons can complement the ocean by opening new possibilities for competition, training and athlete development.”
The 2026 Irukandjis squad features four World Para Surfing Champions!
Leading the team is two-time ISA World Champion Joel Taylor (NSW), who claimed his second consecutive world title in the Prone 1 division in 2025 after an unforgettable final against reigning world champion and fellow Irukandji, Kai Colless (QLD).
The pair showcased Australia's dominance in the division, both earning perfect 10-point rides during one of the standout heats of the event.
Ahead of defending his ISA World Title and chasing a third World Championship, Joel spoke about what it means to once again represent the Irukandjis.
"Representing Australia at the ISA World Para Surfing Championship is everything to me. It’s what I train for all year. I didn’t touch the ocean for 20 years after a spinal cord injury from a wipeout at Pipeline in 2001 left me paralysed from the waist down and confined to a wheelchair for life. I was convinced I would never surf again until I discovered para surfing in 2022."
The move to hold the ISA World Para Championships in a wave pool is widely regarded as a good one:
"The news that the 2026 ISA World Para Surfing Championship will be held at Palm Springs is huge! I’ve long believed that running events in wave pools is the next logical step for competitive para surfing. Pools provide a safe and accessible environment for all competitors and offer a consistent, high performance playing field for competition. This is a really exciting development that will only boost the chances of para surfing being included in the Paralympics for Brisbane 2032. It’s gonna go down in history and I can’t wait to be a part of it!"
Several members of the medal-winning 2025 team return in 2026, including 6X ISA World Champion Mark 'Mono' Stewart (NSW), 2024 World Champion and 2025 Runner-Up, Kai Colless (QLD), 2025 Bronze Medallist's Emma Dieters (NSW) and Grace Kennedy (NSW), 2025 Copper Medallist Cliff Gralton (NSW), and 2026 Australian Champions Annie Goldsmith (SA), and Steve Fox (NSW). South Australia's Jocelyn Neumueller will also rejoin the national team after claiming gold in the Women's Prone-2 division in 2024.
After claiming Bronze in 2025 in the Kneel (PS-K) Division, Emma Dieters (NSW), founder of Northern Beaches Para Surfer Boardriders Inc., established in 2023 at Mona Vale, is eager to continue her remarkable journey on the world stage.
“Representing Australia and the Irukandjis is such a great honour, but it’s about something much deeper than sport. Since acquiring my spinal cord injury in 2021, para surfing has given me focus, purpose and a way to show what is truly possible after life is flipped upside down.
If you told me five years ago I’d be back in the ocean, let alone chasing a 3X World Championship, I wouldn’t have believed you. Every time I wear the iconic Irukandjis green and gold, I’m representing a pathway that saved me and gave me a reason to keep pushing forward. The team camaraderie and support of this incredible community is what makes this journey so special.” Em said
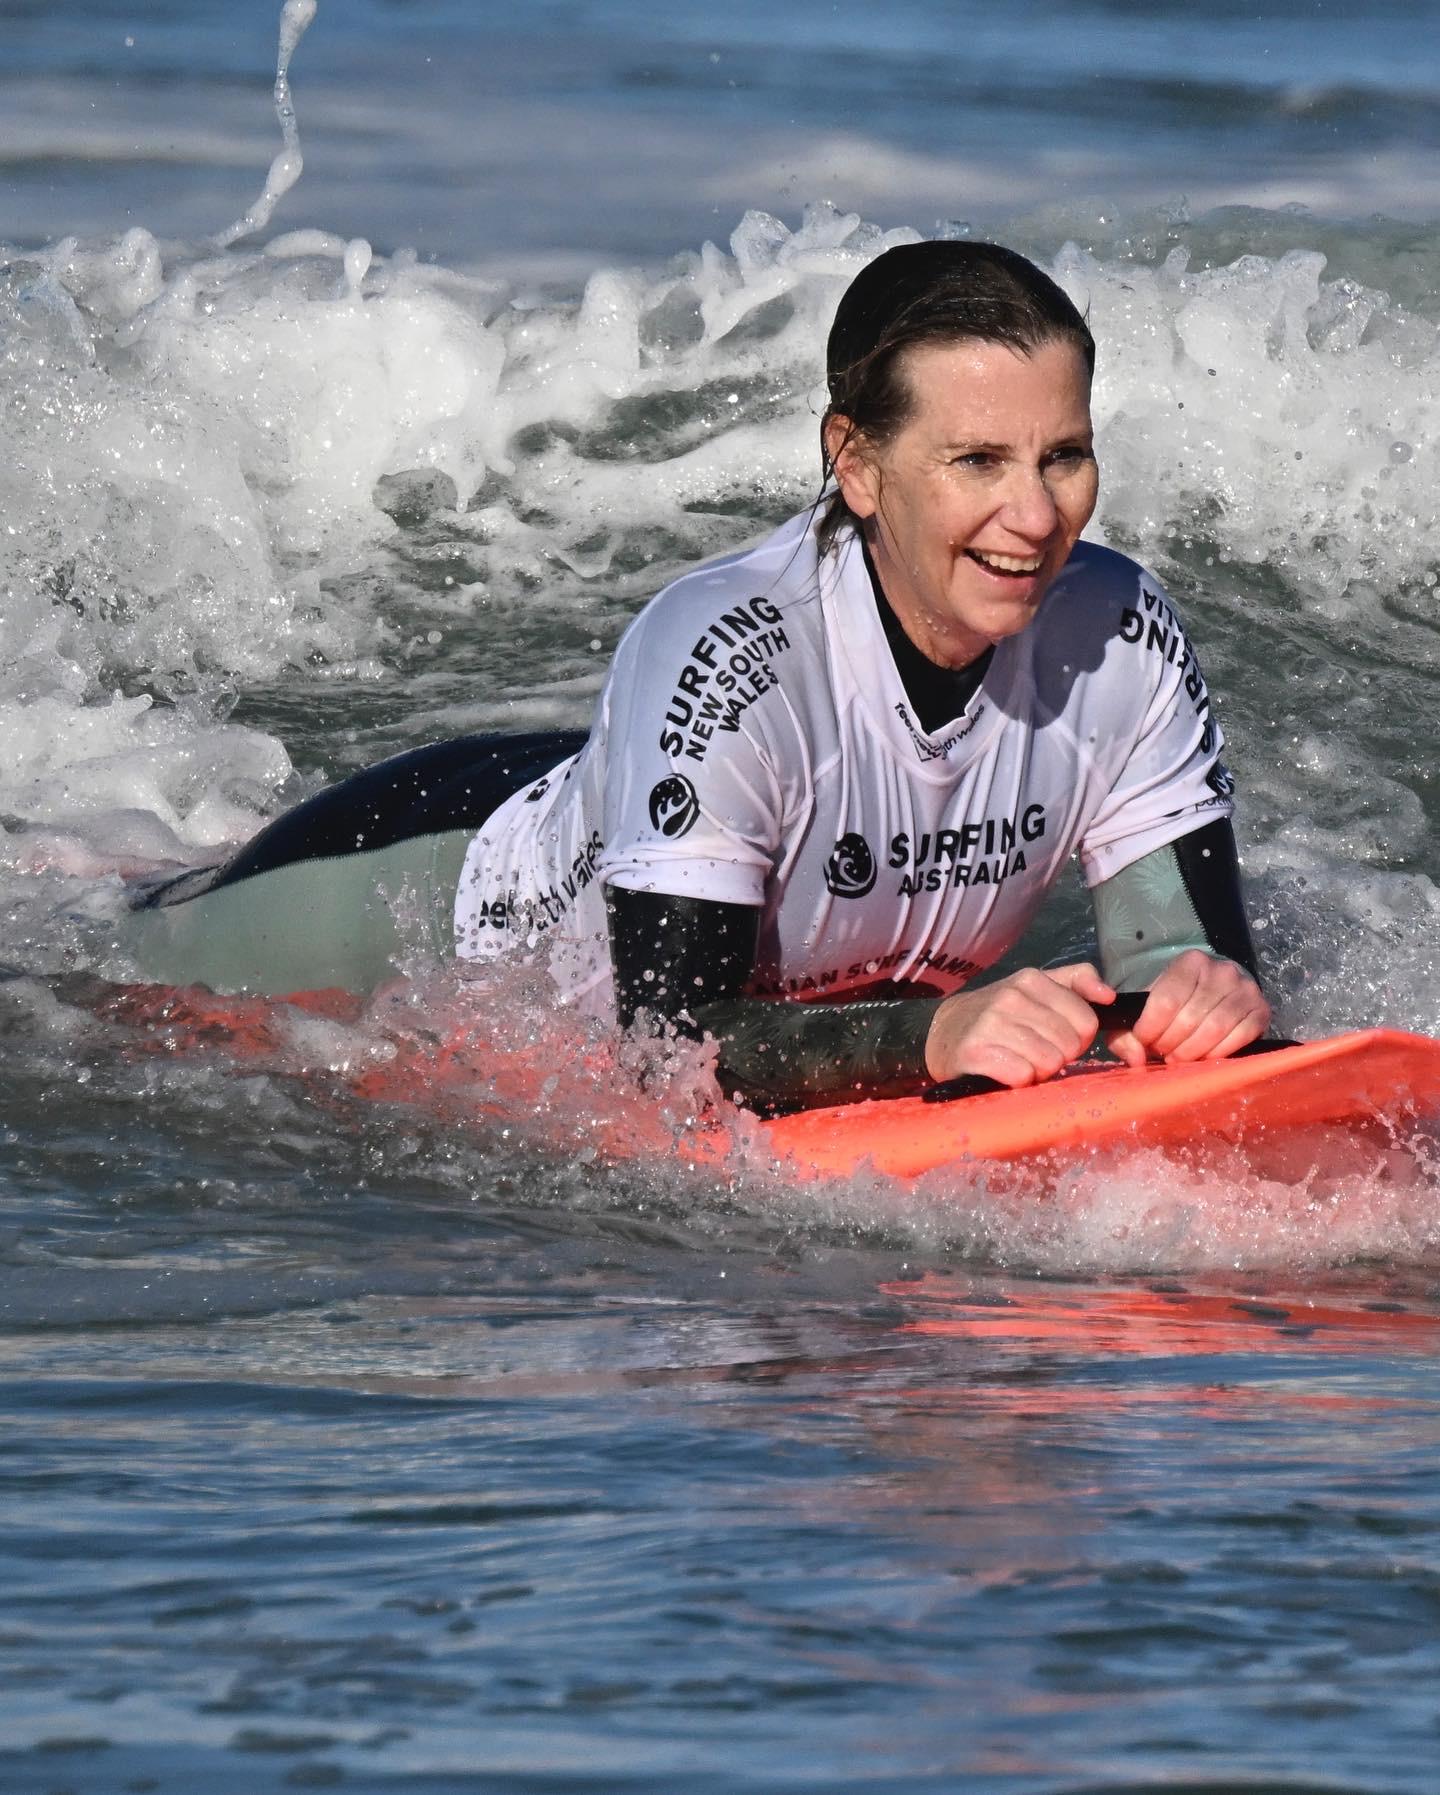
Pittwater's Em Dieters - loving it!
The 2026 squad also welcomes fresh faces in Craig McFadden (NSW), Lachlan James (NSW), Terry McGrath (NSW) and Finn Banks (NSW), highlighting the continued growth and depth of Australian para surfing.
Finn Banks earned selection after winning the Australian Para Surfing Titles Visual Impairment 2 (PS-VI2) in his first appearance at the event, and is relishing the opportunity to represent Australia for the first time.
"I'm super stoked to be representing Australia. It's a huge honour to be part of the team. I love surfing and can't wait to compete with the best para surfers in the world. I met most of the team in Byron and they were all so encouraging and inspiring! Looking forward to the challenge and having a surf trip! I hope others feel encouraged to get out and give it a go!"
Surfing Australia High Performance Director, Kate Wilcomes, reflected on the growth of para surfing in Australia and the calibre of the 2026 Irukandjis team:
“The growth of Para surfing over the past decade has been inspiring to witness. The Irukandjis team brings together a mix of experienced World Champions, returning medallists and new athletes earning their place on the international stage.
“Each athlete has their own unique story and journey, but they all share a passion for the ocean and a commitment to progressing the growth of Australian Para surfing on the world stage.
“Australian Para Surfing is in a great place and we are incredibly proud of this team and excited to support these athletes as they prepare for the 2026 ISA World Para Surfing Championship.”
Support The Para Irukandjis
To support The Irukandjis, Surfing Australia has launched a fundraiser allowing supporters to contribute directly to the team’s journey. As the campaign is largely self-funded, every donation helps cover travel, accommodation and competition expenses, giving Australia’s top adaptive surfers the opportunity to compete on the world stage at the 2026 ISA World Para Surfing Championship.
"We aren’t just covering flights and specialised equipment; many athletes also need to fund travel and accommodation for their support teams, which can mean doubling or tripling the costs. The support of our community through the ASF fundraising campaign means everything. It gives us the freedom to focus on performing in the waves rather than worrying about the bills." - Emma Dieters said
Support the Irukandjis on their journey by donating to the team's official fundraising campaign: https://asf.org.au/campaigns/surfing-australia/2026-isa-irukandjis-para-team
For further updates throughout the event, follow @theirukandjs + @surfingaus on Instagram and Facebook.
2026 ISA World Para Surfing Championship – Team Irukandjis:
Para Surf Stand 1 (PS-S1) MEN's
Craig McFadden (NSW)
Para Surf Stand 2 (PS-S2) MEN's
Lachlan James (NSW)
Para Surf Stand 3 (PS-S3) MEN's
Terry McGrath (NSW)
Para Surf Kneel (PS-K) MEN's
Mark 'Mono' Stewart (NSW)
Para Surf Kneel (PS-K) WOMEN's
Em Dieters (NSW)
Para Surf Prone 1 (PS-P1) MEN's
Joel Taylor (NSW)
Kai Colless (QLD)
Para Surf Prone 1 (PS-P1) WOMEN's
Grace Kennedy (NSW)
Para Surf Prone 2 (PS-P2) MEN's
Cliff Gralton (NSW)
Para Surf Prone 2 (PS-P2) WOMEN's
Annie Goldsmith (SA)
Jocelyn Neumueller (SA)
Para Surf VI 1 (PS-VI1) MEN's
Steve Fox (NSW)
Para Surf VI 2 (PS-VI2) MEN's
Finn Banks (NSW)
Joel Taylor at 2026 Australian Para + 2026 Adaptive Surfing Titles. Credit: Andrew Shield.
About the International Surfing Association
The International Surfing Association (ISA), founded in 1964, is recognized by the International Olympic Committee as the World Governing Authority for Surfing. The ISA governs and defines Surfing as Shortboard, Longboard & Bodyboarding, StandUp Paddle (SUP) Racing and Surfing, Para Surfing, Bodysurfing, Wakesurfing, and all other wave riding activities on any type of waves, and on flat water using wave riding equipment. The ISA crowned its first Men's and Women's World Champions in 1964. It crowned the first Big Wave World Champion in 1965; World Junior Champion in 1980; World Kneeboard Champions in 1982; World Longboard Surfing and World Bodyboard Champions in 1988; World Tandem Surfing Champions in 2006; World Masters Champions in 2007; World StandUp Paddle (SUP, both surfing and racing) and Paddleboard Champions in 2012, and World Para Surfing Champions in 2015.
Para Surfing has experienced incredible growth since the first ISA World Para Surfing Championship in 2015 and continues to grow. During that period, the ISA has continued to refine the Para Surfing Classification system in line with IPC requirements and encouraged its network of 116 member nations to host national and regional competitions.
About DSRT Surf
Opening late Summer 2026, DSRT Surf will introduce the largest Wavegarden Cove in North America, a 5.5-acre surf lagoon capable of generating up to 1,000 customizable waves per hour and offering consistent, surfable waves for beginners through advanced surfers. Lessons, coaching, and progression-based surfing are built into the experience, set against a backdrop where ocean-quality waves are framed by desert mountains. The surrounding beach club includes a three-pool viewing deck with cabanas, a restaurant and bar, a skate park, a pickleball court, and is surrounded by two championship Desert Willow golf courses. Future phases will add a hotel and luxury villas. It is one of the only places in the world where visitors can surf perfect waves in a desert environment. Follow us on @dsrtsurf and visit www.dsrtsurf.com for more information and updates.
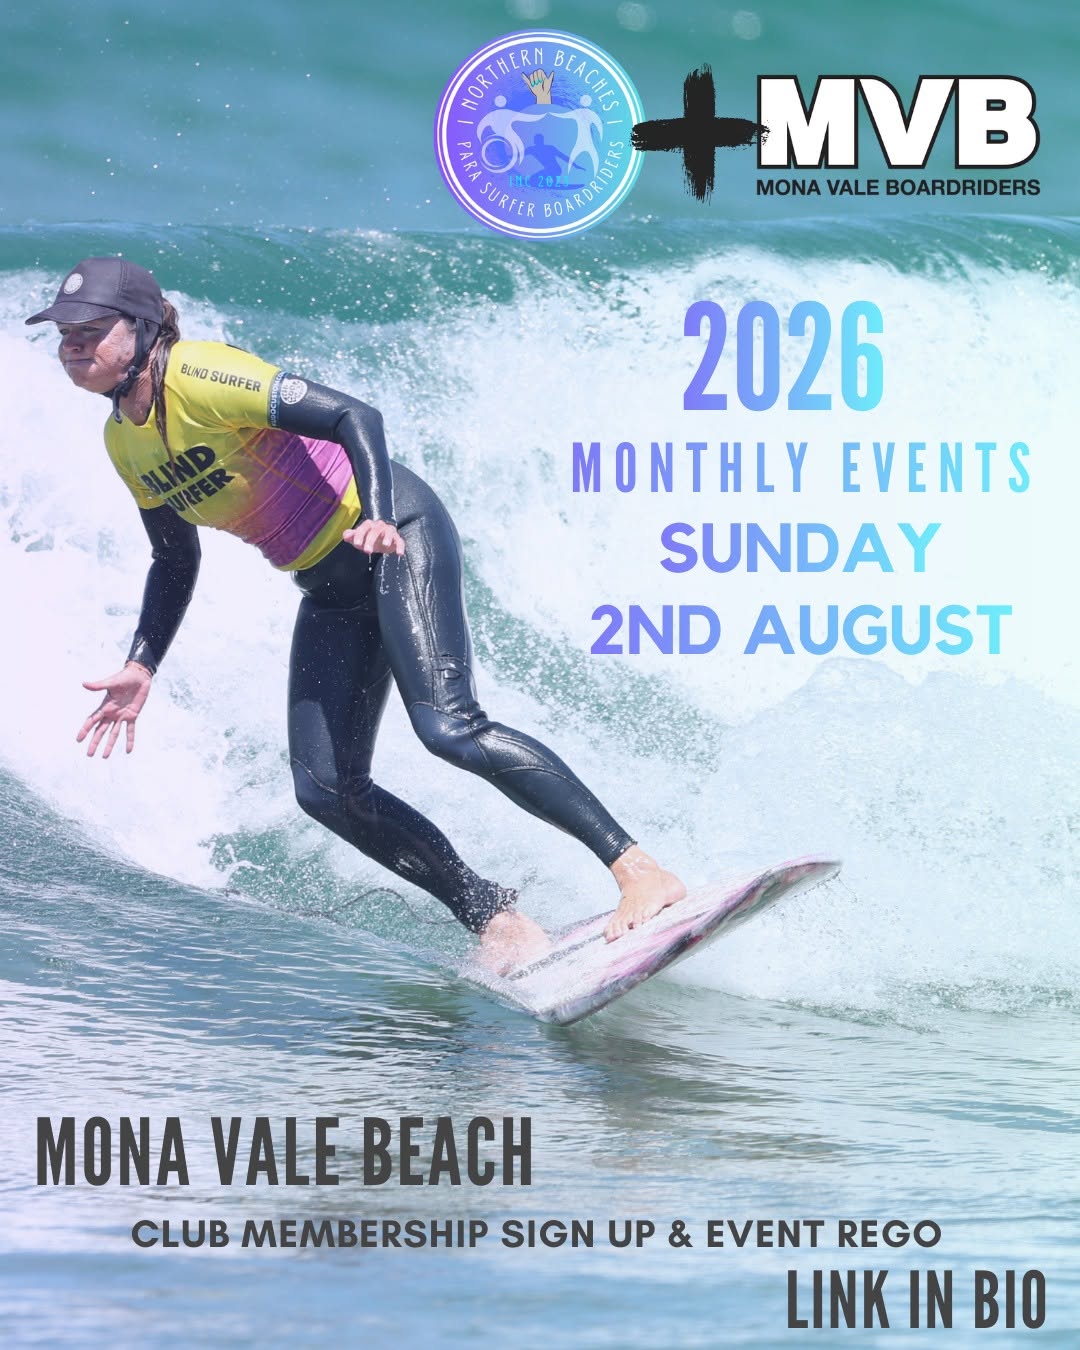
Northern Beaches Para Surfer BC - August Round
In related news, particularly for training, Northern Beaches Para Surfer BC said earlier this week:
"August is almost here! We are back at Mona Vale for another epic monthly round with our Mona Vale Boardriders Club family! Whether you’re chasing waves, volunteering, or soaking up the beachfront atmosphere, lock it in for a morning packed with OceanTherapy, community, and good stoke.
The Details:
- Where: Mona Vale Beach
- When: Arrive from 8:00 AM for BBQ breaky (extra hands for 8 AM setup or afternoon pack down are always appreciated!)
- Para Surfers Heat: Set around high tide—final call confirmed on the day via WhatsApp.
How to Join:
- Member Signup: Join via LiveHeats
- Register to Surf: Head to linktr.ee/nbparasurfer and click 🏄🏻 REGO OPEN - August Round.
- WhatsApp Group: Hop in our chat for real-time location and schedule updates.
- Get Ready: Grab your gear and we'll see you on the sand! 🤙
Spectators and volunteers are always welcome—grab a coffee from The Brightside Cafe and come see what the NBPSB community is all about.