Nature’s Dangerous Decline ‘Unprecedented’; Species Extinction Rates ‘Accelerating’
May 7th, 2019: Intergovernmental Science-Policy Platform on Biodiversity and Ecosystem Services (IPBES)
- Current global response insufficient;
- ‘Transformative changes’ needed to restore and protect nature;
- Opposition from vested interests can be overcome for public good
- Most comprehensive assessment of its kind;
- 1,000,000 species threatened with extinction
Nature is declining globally at rates unprecedented in human history — and the rate of species extinctions is accelerating, with grave impacts on people around the world now likely, warns a landmark new report from the Intergovernmental Science-Policy Platform on Biodiversity and Ecosystem Services (IPBES), the summary of which was approved at the 7th session of the IPBES Plenary, meeting last week (29 April – 4 May) in Paris.
“The overwhelming evidence of the IPBES Global Assessment, from a wide range of different fields of knowledge, presents an ominous picture,” said IPBES Chair, Sir Robert Watson. “The health of ecosystems on which we and all other species depend is deteriorating more rapidly than ever. We are eroding the very foundations of our economies, livelihoods, food security, health and quality of life worldwide.”
“The Report also tells us that it is not too late to make a difference, but only if we start now at every level from local to global,” he said. “Through ‘transformative change’, nature can still be conserved, restored and used sustainably – this is also key to meeting most other global goals. By transformative change, we mean a fundamental, system-wide reorganisation across technological, economic and social factors, including paradigms, goals and values.”
“The member States of IPBES Plenary have now acknowledged that, by its very nature, transformative change can expect opposition from those with interests vested in the status quo, but also that such opposition can be overcome for the broader public good,” Watson said.
The IPBES Global Assessment Report on Biodiversity and Ecosystem Services is the most comprehensive ever completed. It is the first intergovernmental Report of its kind and builds on the landmark Millennium Ecosystem Assessment of 2005, introducing innovative ways of evaluating evidence.
Compiled by 145 expert authors from 50 countries over the past three years, with inputs from another 310 contributing authors, the Report assesses changes over the past five decades, providing a comprehensive picture of the relationship between economic development pathways and their impacts on nature. It also offers a range of possible scenarios for the coming decades.
Based on the systematic review of about 15,000 scientific and government sources, the Report also draws (for the first time ever at this scale) on indigenous and local knowledge, particularly addressing issues relevant to Indigenous Peoples and Local Communities.
“Biodiversity and nature’s contributions to people are our common heritage and humanity’s most important life-supporting ‘safety net’. But our safety net is stretched almost to breaking point,” said Prof. Sandra Díaz (Argentina), who co-chaired the Assessment with Prof. Josef Settele (Germany) and Prof. Eduardo S. Brondízio (Brazil and USA). “The diversity within species, between species and of ecosystems, as well as many fundamental contributions we derive from nature, are declining fast, although we still have the means to ensure a sustainable future for people and the planet.”
The Report finds that around 1 million animal and plant species are now threatened with extinction, many within decades, more than ever before in human history.
The average abundance of native species in most major land-based habitats has fallen by at least 20%, mostly since 1900. More than 40% of amphibian species, almost 33% of reefforming corals and more than a third of all marine mammals are threatened. The picture is less clear for insect species, but available evidence supports a tentative estimate of 10% being threatened. At least 680 vertebrate species had been driven to extinction since the 16th century and more than 9% of all domesticated breeds of mammals used for food and agriculture had become extinct by 2016, with at least 1,000 more breeds still threatened.
“Ecosystems, species, wild populations, local varieties and breeds of domesticated plants and animals are shrinking, deteriorating or vanishing. The essential, interconnected web of life on Earth is getting smaller and increasingly frayed,” said Prof. Settele. “This loss is a direct result of human activity and constitutes a direct threat to human well-being in all regions of the world.”
To increase the policy-relevance of the Report, the assessment’s authors have ranked, for the first time at this scale and based on a thorough analysis of the available evidence, the five direct drivers of change in nature with the largest relative global impacts so far. These culprits are, in descending order: (1) changes in land and sea use; (2) direct exploitation of organisms; (3) climate change; (4) pollution and (5) invasive alien species.
The Report notes that, since 1980, greenhouse gas emissions have doubled, raising average global temperatures by at least 0.7 degrees Celsius – with climate change already impacting nature from the level of ecosystems to that of genetics – impacts expected to increase over the coming decades, in some cases surpassing the impact of land and sea use change and other drivers.
Despite progress to conserve nature and implement policies, the Report also finds that global goals for conserving and sustainably using nature and achieving sustainability cannot be met by current trajectories, and goals for 2030 and beyond may only be achieved through transformative changes across economic, social, political and technological factors. With good progress on components of only four of the 20 Aichi Biodiversity Targets, it is likely that most will be missed by the 2020 deadline. Current negative trends in biodiversity and ecosystems will undermine progress towards 80% (35 out of 44) of the assessed targets of the Sustainable Development Goals, related to poverty, hunger, health, water, cities, climate, oceans and land (SDGs 1, 2, 3, 6, 11, 13, 14 and 15). Loss of biodiversity is therefore shown to be not only an environmental issue, but also a developmental, economic, security, social and moral issue as well.
“To better understand and, more importantly, to address the main causes of damage to biodiversity and nature’s contributions to people, we need to understand the history and global interconnection of complex demographic and economic indirect drivers of change, as well as the social values that underpin them,” said Prof. Brondízio. “Key indirect drivers include increased population and per capita consumption; technological innovation, which in some cases has lowered and in other cases increased the damage to nature; and, critically, issues of governance and accountability. A pattern that emerges is one of global interconnectivity and ‘telecoupling’ – with resource extraction and production often occurring in one part of the world to satisfy the needs of distant consumers in other regions.”
Other notable findings of the Report include[1]:
- Three-quarters of the land-based environment and about 66% of the marine environment have been significantly altered by human actions. On average these trends have been less severe or avoided in areas held or managed by Indigenous Peoples and Local Communities.
- More than a third of the world’s land surface and nearly 75% of freshwater resources are now devoted to crop or livestock production.
- The value of agricultural crop production has increased by about 300% since 1970, raw timber harvest has risen by 45% and approximately 60 billion tons of renewable and nonrenewable resources are now extracted globally every year – having nearly doubled since 1980.
- Land degradation has reduced the productivity of 23% of the global land surface, up to US$577 billion in annual global crops are at risk from pollinator loss and 100-300 million people are at increased risk of floods and hurricanes because of loss of coastal habitats and protection.
- In 2015, 33% of marine fish stocks were being harvested at unsustainable levels; 60% were maximally sustainably fished, with just 7% harvested at levels lower than what can be sustainably fished.
- Urban areas have more than doubled since 1992.
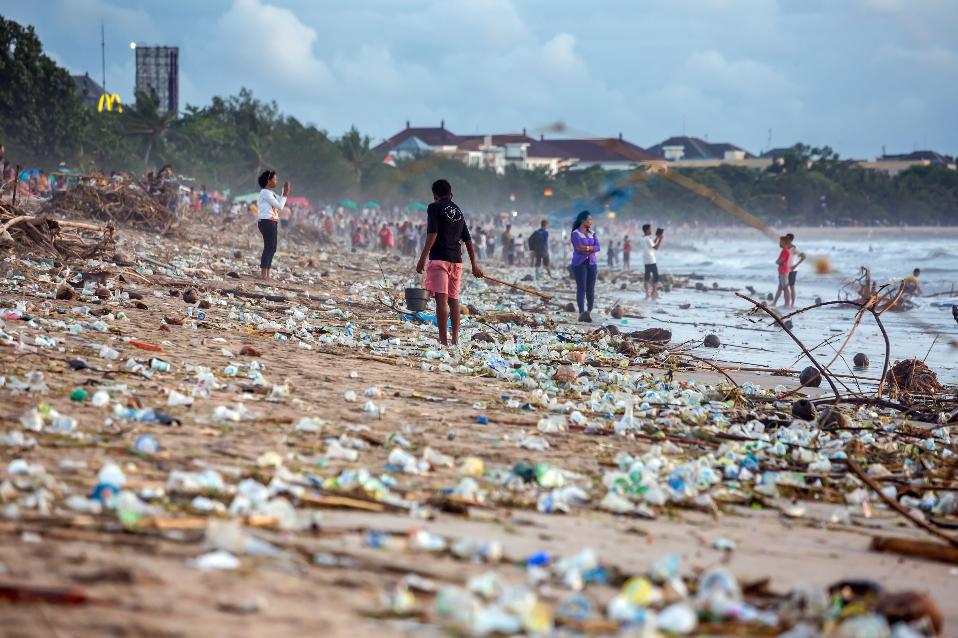
- Plastic pollution has increased tenfold since 1980, 300-400 million tons of heavy metals, solvents, toxic sludge and other wastes from industrial facilities are dumped annually into the world’s waters, and fertilizers entering coastal ecosystems have produced more than 400 ocean ‘dead zones’, totalling more than 245,000 km2 (591-595) - a combined area greater than that of the United Kingdom.
- Negative trends in nature will continue to 2050 and beyond in all of the policy scenarios explored in the Report, except those that include transformative change – due to the projected impacts of increasing land-use change, exploitation of organisms and climate change, although with significant differences between regions.
The Report also presents a wide range of illustrative actions for sustainability and pathways for achieving them across and between sectors such as agriculture, forestry, marine systems, freshwater systems, urban areas, energy, finance and many others. It highlights the importance of, among others, adopting integrated management and cross-sectoral approaches that take into account the trade-offs of food and energy production, infrastructure, freshwater and coastal management, and biodiversity conservation.
Also identified as a key element of more sustainable future policies is the evolution of global financial and economic systems to build a global sustainable economy, steering away from the current limited paradigm of economic growth.
“IPBES presents the authoritative science, knowledge and the policy options to decision-makers for their consideration,” said IPBES Executive Secretary, Dr. Anne Larigauderie. “We thank the hundreds of experts, from around the world, who have volunteered their time and knowledge to help address the loss of species, ecosystems and genetic diversity – a truly global and generational threat to human well-being.”
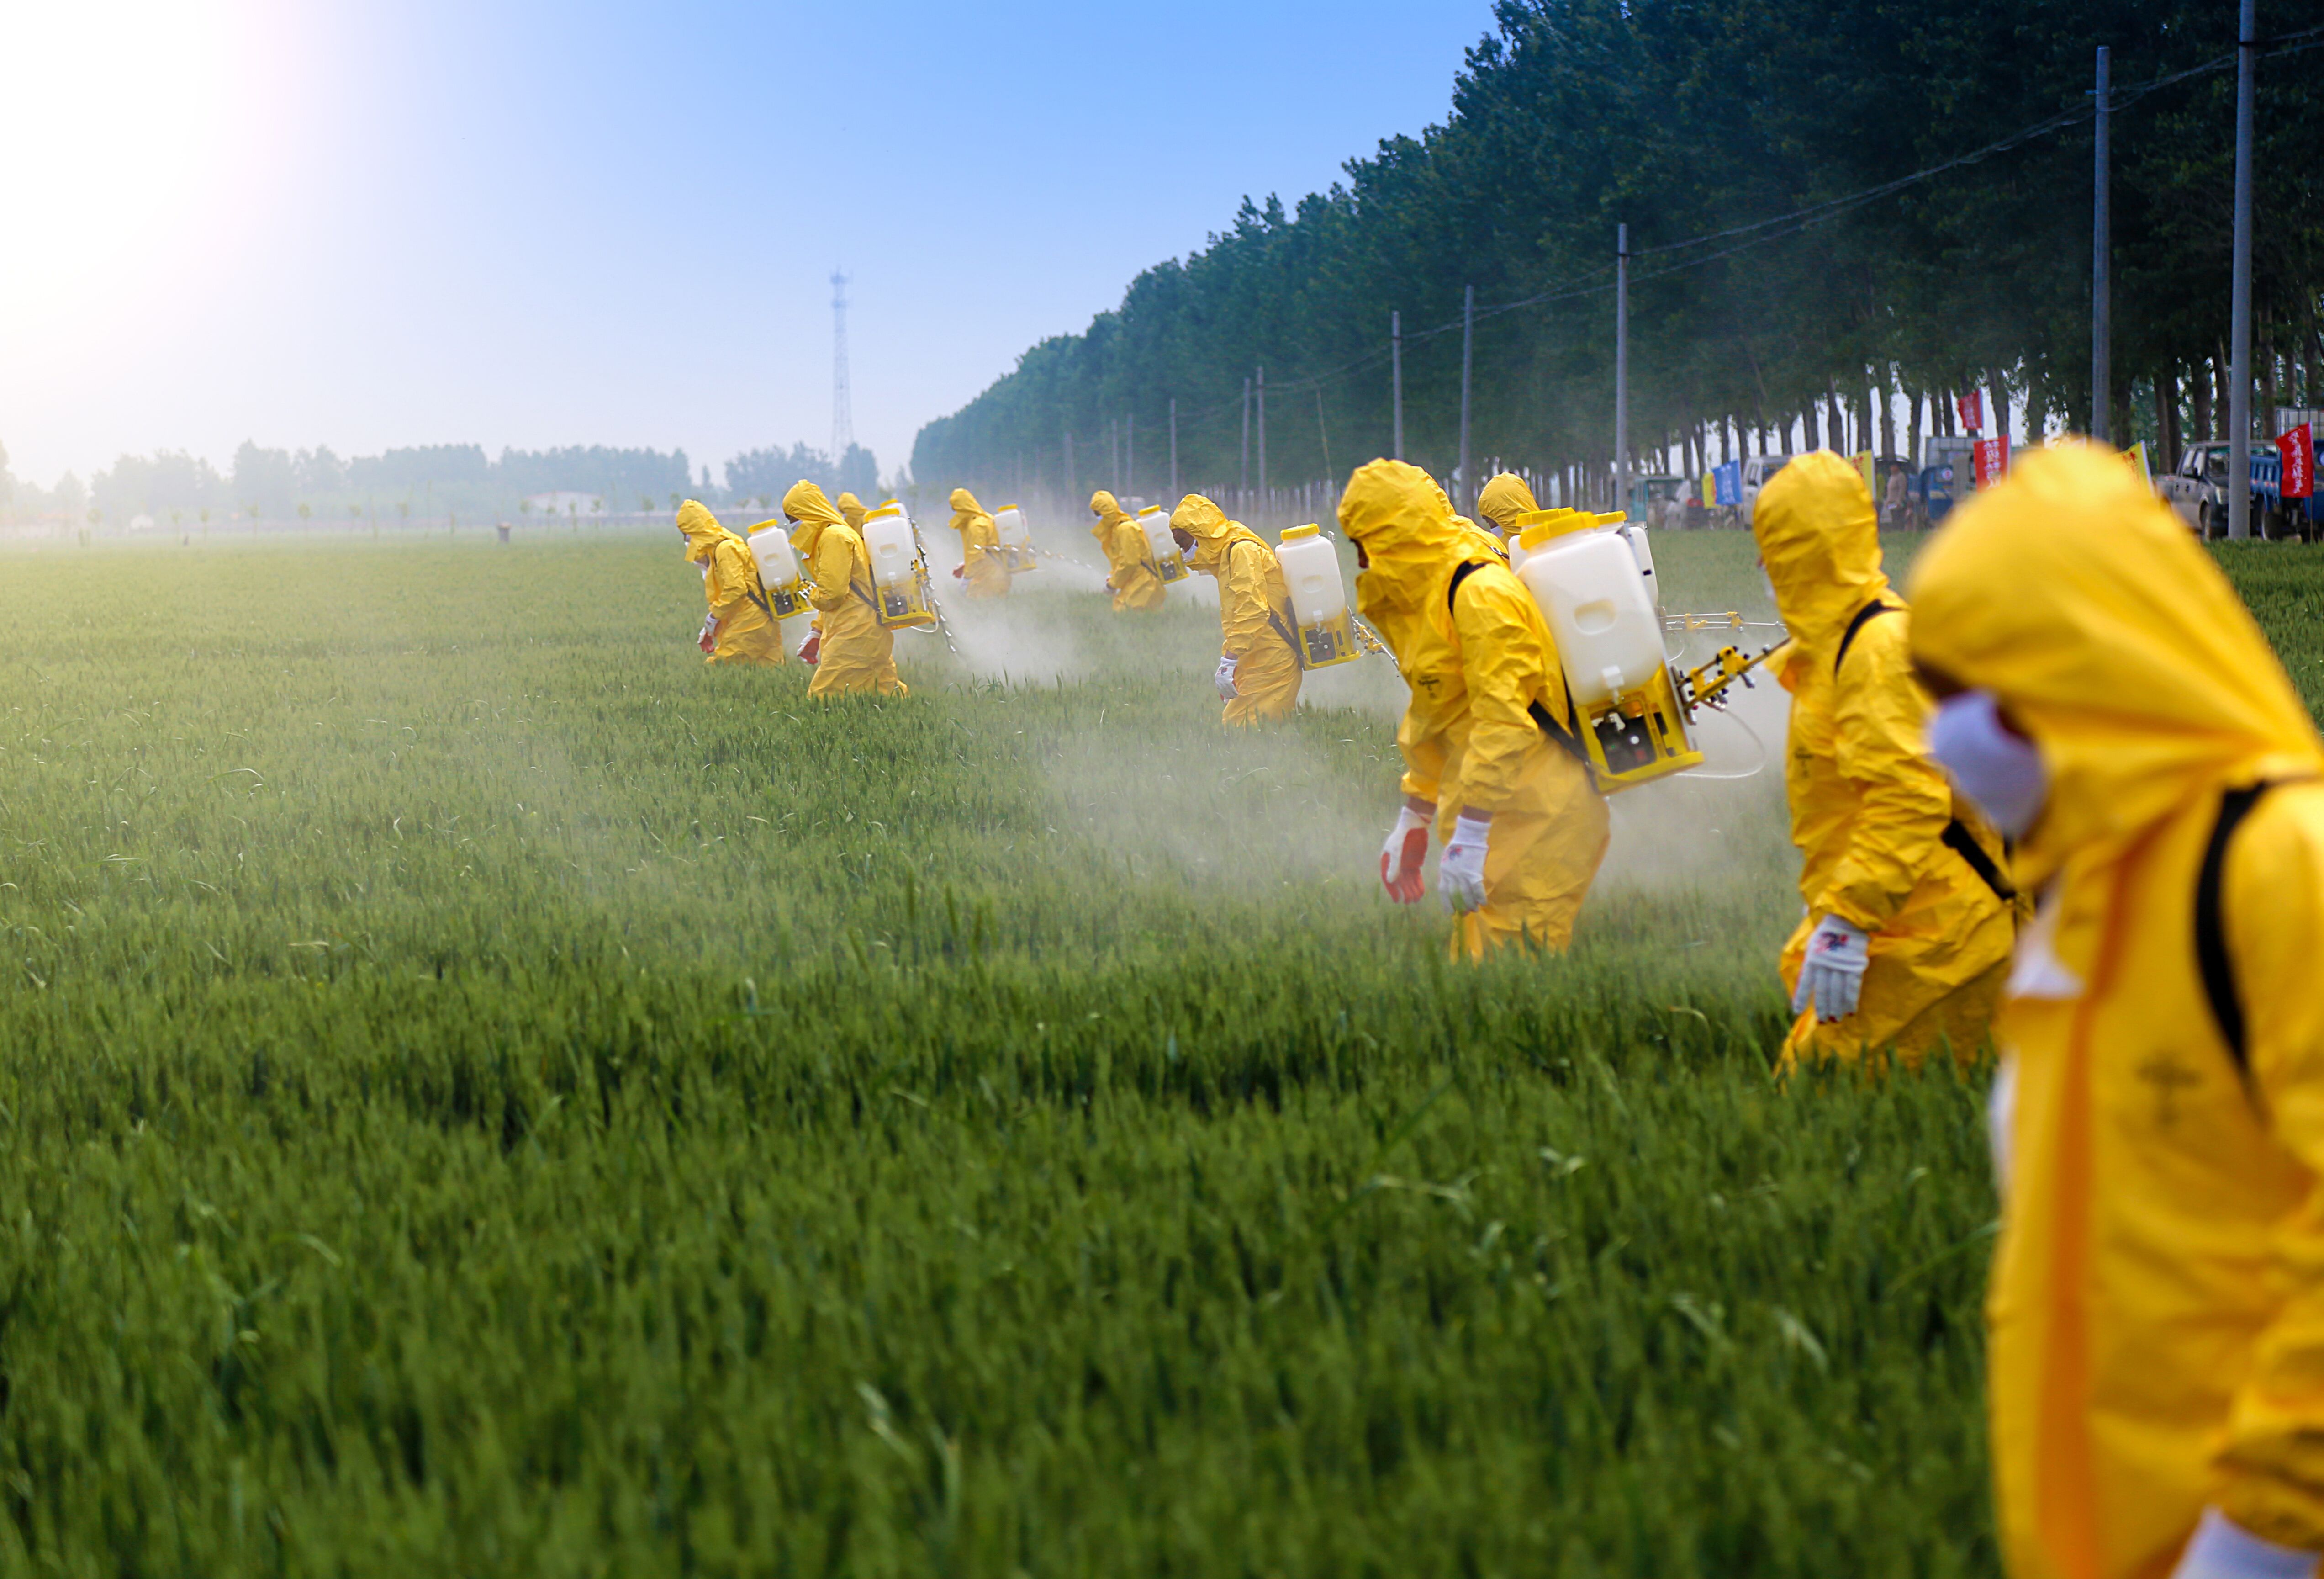
Farmers wearing protective clothing spraying pesticides in a wheat field. Photo credit: Jinning Li/Shutterstock.com
Further Information On Key Issues From The Report
Scale of Loss of Nature
Gains from societal and policy responses, while important, have not stopped massive losses.
Since 1970, trends in agricultural production, fish harvest, bioenergy production and harvest of materials have increased, in response to population growth, rising demand and technological development, this has come at a steep price, which has been unequally distributed within and across countries. Many other key indicators of nature’s contributions to people however, such as soil organic carbon and pollinator diversity, have declined, indicating that gains in material contributions are often not sustainable .
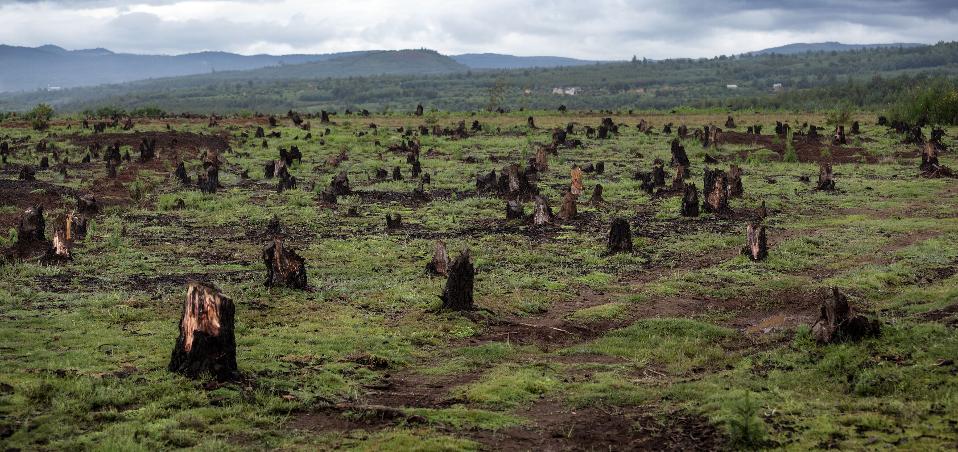
The pace of agricultural expansion into intact ecosystems has varied from country to country. Losses of intact ecosystems have occurred primarily in the tropics, home to the highest levels of biodiversity on the planet. For example, 100 million hectares of tropical forest were lost from 1980 to 2000, resulting mainly from cattle ranching in Latin America (about 42 million hectares) and plantations in South-East Asia (about 7.5 million hectares, of which 80% is for palm oil, used mostly in food, cosmetics, cleaning products and fuel) among others.
Since 1970 the global human population has more than doubled (from 3.7 to 7.6 billion), rising unevenly across countries and regions; and per capita gross domestic product is four times higher – with ever-more distant consumers shifting the environmental burden of consumption and production across regions.
The average abundance of native species in most major land-based habitats has fallen by at least 20%, mostly since 1900.
The numbers of invasive alien species per country have risen by about 70% since 1970, across the 21 countries with detailed records.
The distributions of almost half (47%) of land-based flightless mammals, for example, and almost a quarter of threatened birds, may already have been negatively affected by climate change.
Indigenous Peoples, Local Communities and Nature
At least a quarter of the global land area is traditionally owned, managed, used or occupied by Indigenous Peoples. These areas include approximately 35% of the area that is formally protected, and approximately 35% of all remaining terrestrial areas with very low human intervention.
Nature managed by Indigenous Peoples and Local Communities is under increasing pressure but is generally declining less rapidly than in other lands – although 72% of local indicators developed and used by Indigenous Peoples and Local Communities show the deterioration of nature that underpins local livelihoods.
The areas of the world projected to experience significant negative effects from global changes in climate, biodiversity, ecosystem functions and nature’s contributions to people are also areas in which large concentrations of Indigenous Peoples and many of the world’s poorest communities reside.
Regional and global scenarios currently lack and would benefit from an explicit consideration of the views, perspectives and rights of Indigenous Peoples and Local Communities, their knowledge and understanding of large regions and ecosystems, and their desired future development pathways. Recognition of the knowledge, innovations and practices, institutions and values of Indigenous Peoples and Local Communities and their inclusion and participation in environmental governance often enhances their quality of life, as well as nature conservation, restoration and sustainable use. Their positive contributions to sustainability can be facilitated through national recognition of land tenure, access and resource rights in accordance with national legislation, the application of free, prior and informed consent, and improved collaboration, fair and equitable sharing of benefits arising from the use, and co-management arrangements with local communities.
Global Targets and Policy Scenarios
Past and ongoing rapid declines in biodiversity, ecosystem functions and many of nature’s contributions to people mean that most international societal and environmental goals, such as those embodied in the Aichi Biodiversity Targets and the 2030 Agenda for Sustainable Development will not be achieved based on current trajectories.
The authors of the Report examined six policy scenarios – very different ‘baskets’ of clustered policy options and approaches, including ‘Regional Competition’, ‘Business as Usual’ and ‘Global Sustainability’ - projecting the likely impacts on biodiversity and nature’s contributions to people of these pathways by 2050. They concluded that, except in scenarios that include transformative change, the negative trends in nature, ecosystem functions and in many of nature’s contributions to people will continue to 2050 and beyond due to the projected impacts of increasing land and sea use change, exploitation of organisms and climate change.
Policy Tools, Options and Exemplary Practices
Policy actions and societal initiatives are helping to raise awareness about the impact of consumption on nature, protecting local environments, promoting sustainable local economies and restoring degraded areas. Together with initiatives at various levels these have contributed to expanding and strengthening the current network of ecologically representative and well-connected protected area networks and other effective area-based conservation measures, the protection of watersheds and incentives and sanctions to reduce pollution .
The Report presents an illustrative list of possible actions and pathways for achieving them across locations, systems and scales, which will be most likely to support sustainability. Taking an integrated approach:
In agriculture, the Report emphasises, among others: promoting good agricultural and agroecological practices; multifunctional landscape planning (which simultaneously provides food security, livelihood opportunities, maintenance of species and ecological functions) and cross-sectoral integrated management. It also points to the importance of deeper engagement of all actors throughout the food system (including producers, the public sector, civil society and consumers) and more integrated landscape and watershed management; conservation of the diversity of genes, varieties, cultivars, breeds, landraces and species; as well as approaches that empower consumers and producers through market transparency, improved distribution and localisation (that revitalises local economies), reformed supply chains and reduced food waste.
In marine systems, the Report highlights, among others: ecosystem-based approaches to fisheries management; spatial planning; effective quotas; marine protected areas; protecting and managing key marine biodiversity areas; reducing run- off pollution into oceans and working closely with producers and consumers.
In freshwater systems, policy options and actions include, among others: more inclusive water governance for collaborative water management and greater equity; better integration of water resource management and landscape planning across scales; promoting practices to reduce soil erosion, sedimentation and pollution run-off; increasing water storage; promoting investment in water projects with clear sustainability criteria; as well as addressing the fragmentation of many freshwater policies.
In urban areas, the Report highlights, among others: promotion of nature-based solutions; increasing access to urban services and a healthy urban environment for low-income communities; improving access to green spaces; sustainable production and consumption and ecological connectivity within urban spaces, particularly with native species.
Across all examples, the Report recognises the importance of including different value systems and diverse interests and worldviews in formulating policies and actions. This includes the full and effective participation of Indigenous Peoples and Local Communities in governance, the reform and development of incentive structures and ensuring that biodiversity considerations are prioritised across all key sector planning.
“We have already seen the first stirrings of actions and initiatives for transformative change, such as innovative policies by many countries, local authorities and businesses, but especially by young people worldwide,” said Sir Robert Watson. “From the young global shapers behind the #VoiceforthePlanet movement, to school strikes for climate, there is a groundswell of understanding that urgent action is needed if we are to secure anything approaching a sustainable future. The IPBES Global Assessment Report offers the best available expert evidence to help inform these decisions, policies and actions – and provides the scientific basis for the biodiversity framework and new decadal targets for biodiversity, to be decided in late 2020 in China, under the auspices of the UN Convention on Biological Diversity.”
The full six-chapter Report (including all data) is expected to exceed 1,500 pages and will be published later this year.
By The Numbers – Key Statistics And Facts From The Report
General
- 75%: terrestrial environment “severely altered” to date by human actions (marine environments 66%)
- 47%: reduction in global indicators of ecosystem extent and condition against their estimated natural baselines, with many continuing to decline by at least 4% per decade
- 28%: global land area held and/or managed by Indigenous Peoples , including >40% of formally protected areas and 37% of all remaining terrestrial areas with very low human intervention
- +/-60 billion: tons of renewable and non-renewable resources extracted globally each year, up nearly 100% since 1980
- 15%: increase in global per capita consumption of materials since 1980
- >85%: of wetlands present in 1700 had been lost by 2000 – loss of wetlands is currently three times faster, in percentage terms, than forest loss.
Species, Populations and Varieties of Plants and Animals
- 8 million: total estimated number of animal and plant species on Earth (including 5.5 million insect species)
- Tens to hundreds of times: the extent to which the current rate of global species extinction is higher compared to average over the last 10 million years, and the rate is accelerating
- Up to 1 million: species threatened with extinction, many within decades
- >500,000 (+/-9%): share of the world’s estimated 5.9 million terrestrial species with insufficient habitat for long term survival without habitat restoration
- >40%: amphibian species threatened with extinction
- Almost 33%: reef forming corals, sharks and shark relatives, and >33% marine mammals threatened with extinction
- 25%: average proportion of species threatened with extinction across terrestrial, freshwater and marine vertebrate, invertebrate and plant groups that have been studied in sufficient detail
- At least 680: vertebrate species driven to extinction by human actions since the 16th century
- +/-10%: tentative estimate of proportion of insect species threatened with extinction
- >20%: decline in average abundance of native species in most major terrestrial biomes, mostly since 1900
- +/-560 (+/-10%): domesticated breeds of mammals were extinct by 2016, with at least 1,000 more threatened
- 3.5%: domesticated breed of birds extinct by 2016
- 70%: increase since 1970 in numbers of invasive alien species across 21 countries with detailed records
- 30%: reduction in global terrestrial habitat integrity caused by habitat loss and deterioration
- 47%: proportion of terrestrial flightless mammals and 23% of threatened birds whose distributions may have been negatively impacted by climate change already
- >6: species of ungulate (hoofed mammals) would likely be extinct or surviving only in captivity today without conservation measures
Food and Agriculture
- 300%: increase in food crop production since 1970
- 23%: land areas that have seen a reduction in productivity due to land degradation
- >75%: global food crop types that rely on animal pollination
- US$235 to US$577 billion: annual value of global crop output at risk due to pollinator loss
- 5.6 gigatons: annual CO2 emissions sequestered in marine and terrestrial ecosystems – equivalent to 60% of global fossil fuel emission
- +/-11%: world population that is undernourished
- 100 million: hectares of agricultural expansion in the tropics from 1980 to 2000, mainly cattle ranching in Latin America (+/-42 million ha), and plantations in Southeast Asia (+/-7.5 million ha, of which 80% is oil palm), half of it at the expense of intact forests
- 3%: increase in land transformation to agriculture between 1992 and 2015, mostly at the expense of orests
- >33%: world’s land surface (and +/-75% of freshwater resources) devoted to crop or livestock production
- 12%: world’s ice-free land used for crop production
- 25%: world’s ice-free land used for grazing (+/-70% of drylands)
- +/-25%: greenhouse gas emissions caused by land clearing, crop production and fertilization, with animal-based food contributing 75% to that figure
- +/-30%: global crop production and global food supply provided by small land holdings (<2 ha), using +/-25% of agricultural land, usually maintaining rich agrobiodiversity
- $100 billion: estimated level of financial support in OECD countries (2015) to agriculture that is potentially harmful to the environment
Oceans and Fishing
- 33%: marine fish stocks in 2015 being harvested at unsustainable levels; 60% are maximally sustainably fished; 7% are underfished
- >55%: ocean area covered by industrial fishing
- 3-10%: projected decrease in ocean net primary production due to climate change alone by the end of the century
- 3-25%: projected decrease in fish biomass by the end of the century in low and high climate warming scenarios, respectively
- >90%: proportion of the global commercial fishers accounted for by small scale fisheries (over 30 million people) – representing nearly 50% of global fish catch
- Up to 33%: estimated share in 2011 of world’s reported fish catch that is illegal, unreported or unregulated
- >10%: decrease per decade in the extent of seagrass meadows from 1970-2000
- +/-50%: live coral cover of reefs lost since 1870s
- 100-300 million: people in coastal areas at increased risk due to loss of coastal habitat protection
- 400: low oxygen (hypoxic) coastal ecosystem ‘dead zones’ caused by fertilizers, affecting >245,000 km2
- 29%: average reduction in the extinction risk for mammals and birds in 109 countries thanks to conservation investments from 1996 to 2008; the extinction risk of birds, mammals and amphibians would have been at least 20% greater without conservation action in recent decade
- >107: highly threatened birds, mammals and reptiles estimated to have benefitted from the eradication of invasive mammals on islands
Forests
- 45%: increase in raw timber production since 1970 (4 billion cubic meters in 2017)
- +/-13 million: forestry industry jobs
- 50%: agricultural expansion that occurred at the expense of forests
- 50%: decrease in net rate of forest loss since the 1990s (excluding those managed for timber or agricultural extraction)
- 68%: global forest area today compared with the estimated pre-industrial level
- 7%: reduction of intact forests (>500 sq. km with no human pressure) from 2000-2013 in developed and developing countries
- 290 million ha (+/-6%): native forest cover lost from 1990-2015 due to clearing and wood harvesting
- 110 million ha: rise in the area of planted forests from 1990-2015
- 10-15%: global timber supplies provided by illegal forestry (up to 50% in some areas)
- >2 billion: people who rely on wood fuel to meet their primary energy needs
Mining and Energy
- <1%: total land used for mining, but the industry has significant negative impacts on biodiversity, emissions, water quality and human health
- +/-17,000: large-scale mining sites (in 171 countries), mostly managed by 616 international corporations
- +/-6,500: offshore oil and gas ocean mining installations ((in 53 countries)
- US$345 billion: global subsidies for fossil fuels resulting in US$5 trillion in overall costs, including nature deterioration externalities; coal accounts for 52% of post-tax subsidies, petroleum for +/-33% and natural gas for +/-10%
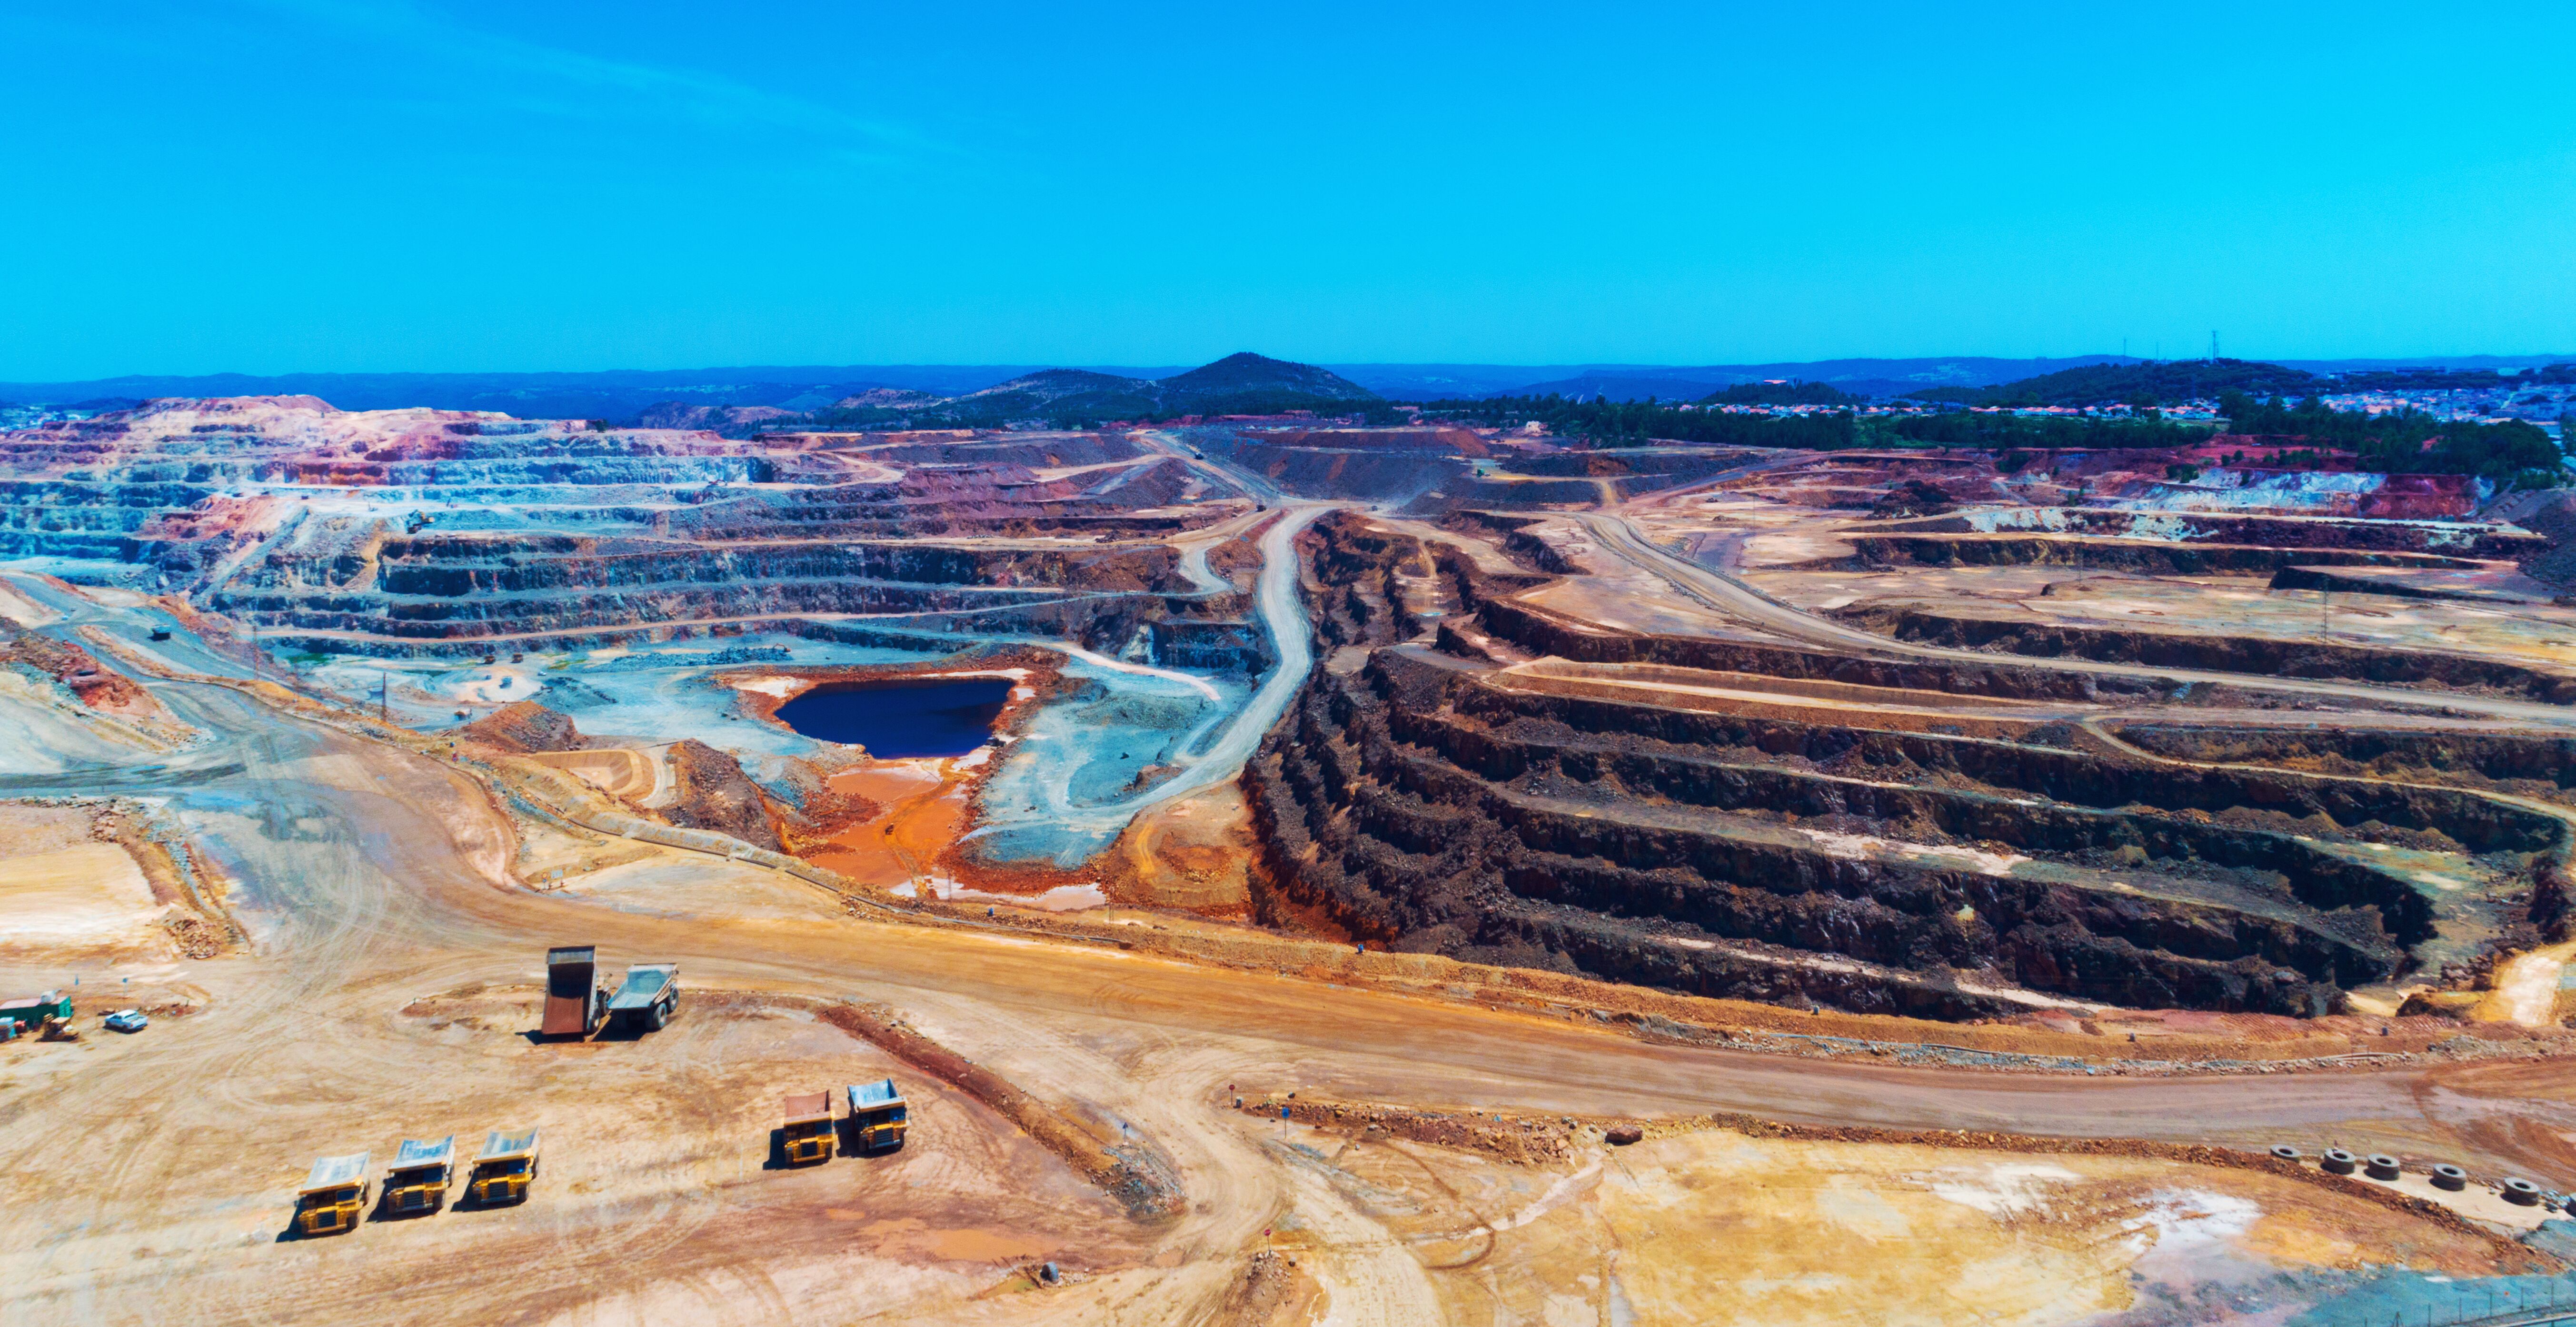
Open copper mine pit - Photo credit: Denis Zhitnik/Shutterstock.com
Urbanisation, Development and Socioeconomic Issues
- >100%: growth of urban areas since 1992
- 25 million km: length of new paved roads foreseen by 2050, with 90% of construction in least developed and developing countries
- +/-50,000: number of large dams (>15m height) ; +/-17 million reservoirs (>0.01 ha)
- 105%: increase in global human population (from 3.7 to 7.6 billion) since 1970 unevenly across countries and regions
- 50 times higher: per capita GDP in developed vs. least developed countries
- >2,500: conflicts over fossil fuels, water, food and land currently occurring worldwide
- >1,000: environmental activists and journalists killed between 2002 and 2013
Health
- 70%: proportion of cancer drugs that are natural or synthetic products inspired by nature
- +/-4 billion: people who rely primarily on natural medicines
- 17%: infectious diseases spread by animal vectors, causing >700,000 annual deaths
- +/-821 million: people face food insecurity in Asia and Africa
- 40%: of the global population lacks access to clean and safe drinking water
- >80%: global wastewater discharged untreated into the environment
- 300-400 million tons: heavy metals, solvents, toxic sludge, and other wastes from industrial facilities dumped annually into the world’s waters
- 10 times: increase in plastic pollution since 1980
Climate Change
- 1 degree Celsius: average global temperature difference in 2017 compared to pre-industrial levels, rising +/-0.2 (+/-0.1) degrees Celsius per decade
- >3 mm: annual average global sea level rise over the past two decades
- 16-21 cm: rise in global average sea level since 1900
- 100% increase since 1980 in greenhouse gas emissions, raising average global temperature by at least 0.7 degree
- 40%: rise in carbon footprint of tourism (to 4.5Gt of carbon dioxide) from 2009 to 2013
- 8%: of total greenhouse gas emissions are from transport and food consumption related to tourism
- 5%: estimated fraction of species at risk of extinction from 2°C warming alone, rising to 16% at 4.3°C warming
- Even for global warming of 1.5 to 2 degrees, the majority of terrestrial species ranges are projected to shrink profoundly.
Global Goals
- Most: Aichi Biodiversity Targets for 2020 likely to be missed
- 22 of 44: assessed targets under the Sustainable Development Goals related to poverty, hunger, health, water, cities, climate, ocean and land are being undermined by substantial negative trends in nature and its contributions to people
- 72%: of local indicators in nature developed and used by Indigenous Peoples and Local Communities that show negative trends
- 4: number of Aichi Targets where good progress has been made on certain components, with moderate progress on some components of another 7 targets, poor progress on all components of 6 targets, and insufficient information to assess progress on some or all components of the remaining 3 targets
__________________
IPBES Partner Comments
“Nature makes human development possible but our relentless demand for the earth’s resources is accelerating extinction rates and devastating the world’s ecosystems. UN Environment is proud to support the Global Assessment Report produced by the Intergovernmental Science-Policy Platform on Biodiversity and Ecosystem Services because it highlights the critical need to integrate biodiversity considerations in global decision-making on any sector or challenge, whether its water or agriculture, infrastructure or business.” - Joyce Msuya, Acting Head, UN Environment
“Across cultures, humans inherently value nature. The magic of seeing fireflies flickering long into the night is immense. We draw energy and nutrients from nature. We find sources of food, medicine, livelihoods and innovation in nature. Our well-being fundamentally depends on nature. Our efforts to conserve biodiversity and ecosystems must be underpinned by the best science that humanity can produce. This is why the scientific evidence compiled in this IPBES Global Assessment is so important. It will help us build a stronger foundation for shaping the post 2020 global biodiversity framework: the ‘New Deal for Nature and People’; and for achieving the SDGs.” - Achim Steiner, Administrator, United Nations Development Programme
“This essential report reminds each of us of the obvious truth: the present generations have the responsibility to bequeath to future generations a planet that is not irreversibly damaged by human activity. Our local, indigenous and scientific knowledge are proving that we have solutions and so no more excuses: we must live on earth differently. UNESCO is committed to promoting respect of the living and of its diversity, ecological solidarity with other living species, and to establish new, equitable and global links of partnership and intragenerational solidarity, for the perpetuation of humankind.” - Audrey Azoulay, Director-General, UNESCO
“The IPBES' 2019 Global Assessment Report on Biodiversity and Ecosystem Services comes at a critical time for the planet and all its peoples. The report’s findings — and the years of diligent work by the many scientists who contributed— will offer a comprehensive view of the current conditions of global biodiversity. Healthy biodiversity is the essential infrastructure that supports all forms of life on earth, including human life. It also provides nature-based solutions on many of the most critical environmental, economic, and social challenges that we face as human society, including climate change, sustainable development, health, and water and food security. We are currently in the midst of preparing for the 2020 UN Biodiversity Conference, in China, which will mark the close of the Aichi Biodiversity Targets and set the course for a post 2020 ecologically focused sustainable development pathway to deliver multiple benefits for people, the planet and our global economy. The IPBES report will serve as a fundamental baseline of where we are and where we need to go as a global community to inspire humanity to reach the 2050 Vision of the UN Biodiversity Convention “Living in harmony with nature”. I want to extend my thanks and congratulations to the IPBES community for their hard work, immense contributions and continued partnership.” - Cristiana Paşca Palmer, Executive Secretary, Convention on Biological Diversity
“The Global Assessment of biodiversity and ecosystem services adds a major element to the body of evidence for the importance of biodiversity to efforts to achieve the Zero Hunger objective and meet the Sustainable Development Goals. Together, assessments undertaken by IPBES, FAO, CBD and other organizations point to the urgent need for action to better conserve and sustainably use biodiversity and to the importance of cross-sectoral and multidisciplinary collaboration among decision-makers and other stakeholders at all levels.” - José Graziano da Silva, Director-General, Food and Agriculture Organisation of the United Nations